













官方供应商
我们作为官方授权经销商,直接提供超过200家开发厂家所发行超过1000个的产品授权给您。
查看我们的所有品牌。
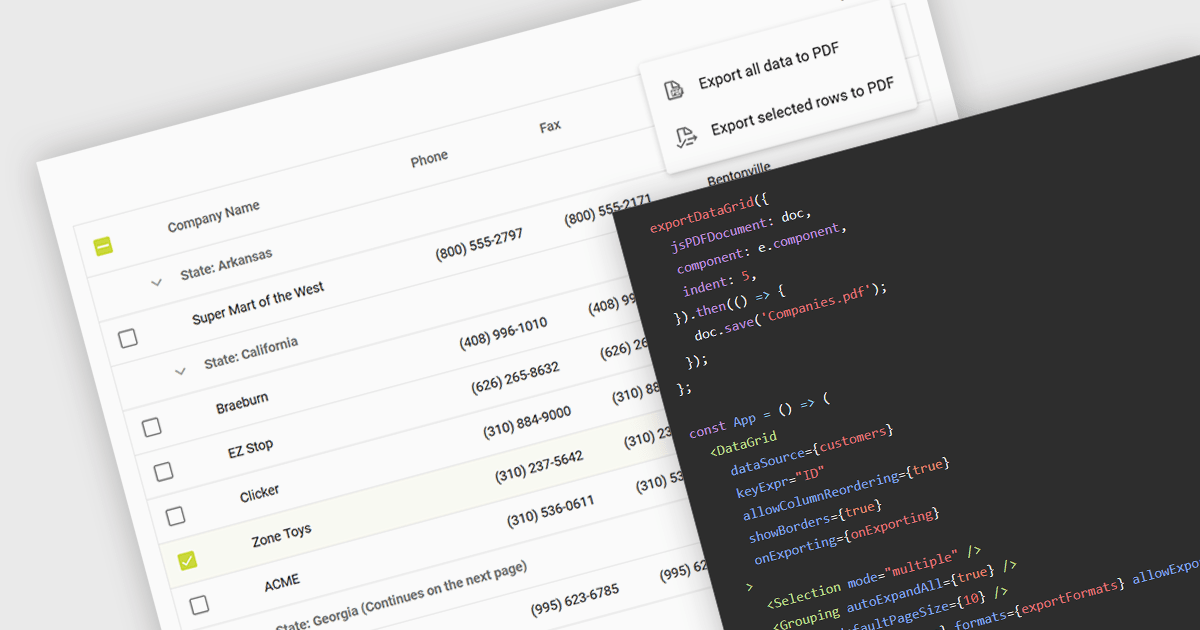
Exporting a data grid to PDF captures the grid layout, including columns, rows, and formatting, and transforms it into a universally accessible and easily shareable document. The export creates a static file, retaining the original grid layout and formatting, that can be easily distributed and viewed consistently across different platforms and on any device with a PDF reader. Additionally, PDFs provide a secure format for preserving data integrity and can be protected against unauthorized editing, making them ideal for official documentation and archiving purposes. This functionality enhances collaboration and data dissemination efficiency by simplifying the sharing and printing processes while maintaining the original data structure and presentation.
Several React grid components allow you to export to PDF, including:
For an in-depth analysis of features and price, visit our comparison of React grid components.
GroupDocs.Watermark for Node.js via Java empowers developers with a powerful document watermarking solution designed to seamlessly integrate into Node.js applications. This library, leveraging the capabilities of the Java API, extends Node.js functionality to add, search for, and remove watermarks from various document formats. Supported formats include popular choices like PDF, Microsoft Office suite files (Word, Excel, PowerPoint), and common image formats (JPEG, PNG, etc.).
This robust solution offers a multitude of benefits for developers. It bolsters document security by embedding watermarks, such as text or images, to deter unauthorized copying. Customization options allow for fine-tuning watermark appearance, including font styles, opacity, and positioning within the document. GroupDocs.Watermark for Node.js via Java caters to various use cases, including protecting sensitive documents, branding presentations, and adding copyright information to images.
GroupDocs.Watermark for Node.js via Java is offered as Developer Small Business, Developer OEM, Site Small Business, and Site OEM licenses catering to a range of business needs. Licenses are perpetual, and include 1 year of support and maintenance. Subscription renewals are also available. See our GroupDocs.Watermark for Node.js via Java licensing page for full details.
GroupDocs.Watermark for Node.js via Java is available in the following products:
Wijmo by MESCIUS is a comprehensive JavaScript library offering a suite of high-performance UI components and data grids specifically designed to streamline the development of modern enterprise applications. It emphasizes reduced development time and improved maintainability, along with a focus on performance through its efficient design and small module size. Wijmo integrates seamlessly with popular JavaScript frameworks like Angular, React, and Vue.js, and supports cutting-edge technologies like TypeScript, making it a versatile solution for building complex web applications.
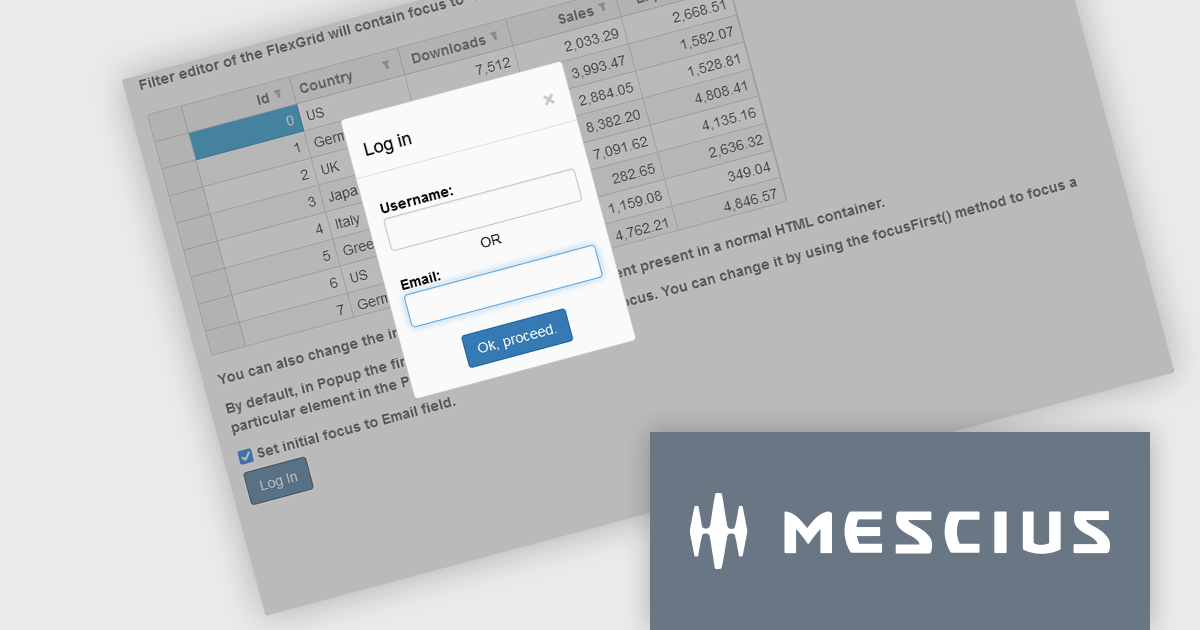
The Wijmo 2024 v1 (Build 5.20241.19) update introduces a new focusFirst Utility that allows developers to set which part of a component should get the initial focus. Setting the first interactive element upon loading a container control improves accessibility by ensuring a clear starting point for keyboard interaction. For example instead of the default focus point of a login dialog being the username field, the email address field could be set as the initial focus point.
To see a full list of what's new in 2024 v1 (Build 5.20241.19), see our release notes.
Wijmo is licensed per developer. Developer Licenses are perpetual and include 1 year Subscription which provides upgrades, including bug fixes and new features. See our Wijmo licensing page for full details.
Learn more on our Wijmo product page.
Highcharts is a JavaScript charting framework that allows web developers and data analysts to generate dynamic, visually appealing charts and graphs for websites and web applications. It can display a variety of chart types, including line, spline, area, column, bar, pie, scatter, and many more. Highcharts is well-known for its ease of use, rich documentation, and ability to handle huge datasets efficiently. Features include responsive design, accessibility support, and cross-browser compatibility. Its customization capabilities allow users to create bespoke data visualizations that increase engagement and provide insightful data presentations.
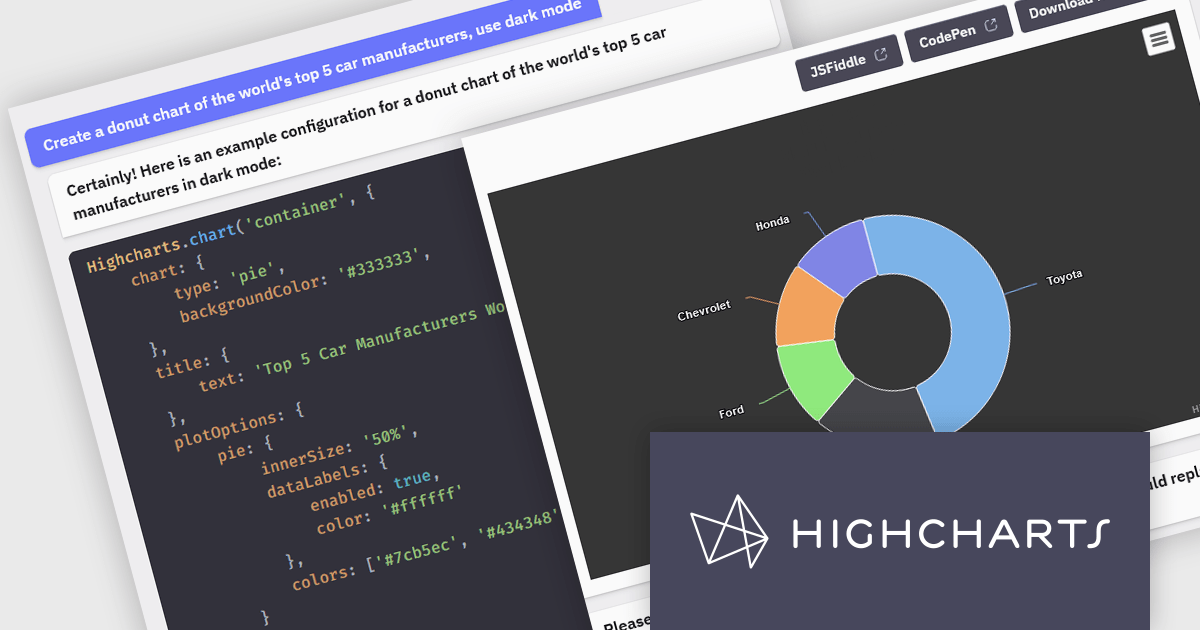
The Highcharts GPT add-on (powered by ChatGPT), and GitHub Copilot support in Highsoft products provide software developers with significant productivity enhancements by integrating AI-driven code assistance directly into their workflow. The Highcharts GPT add-on leverages natural language processing to generate and customize complex chart configurations, reducing the time and effort required for manual coding and enabling developers to focus on higher-level design and functionality. GitHub Copilot integration further streamlines development by offering intelligent code completions and suggestions, facilitating rapid prototyping and error reduction. Together, these Artificial Intelligence tools enhance coding efficiency, improve accuracy, and accelerate the development of sophisticated data visualizations.
For more information see the Highcharts GPT and Highcharts + Github Copilot blog posts.
Highcharts Core is licensed on an annual or perpetual basis, OEM licenses, and Advantage Renewals. It is licensed per Developer and has several license options including Internal, SaaS, SaaS+, and Self Hosted. See our Highcharts Core licensing page for full details.
Learn more on our Highcharts Core product page.
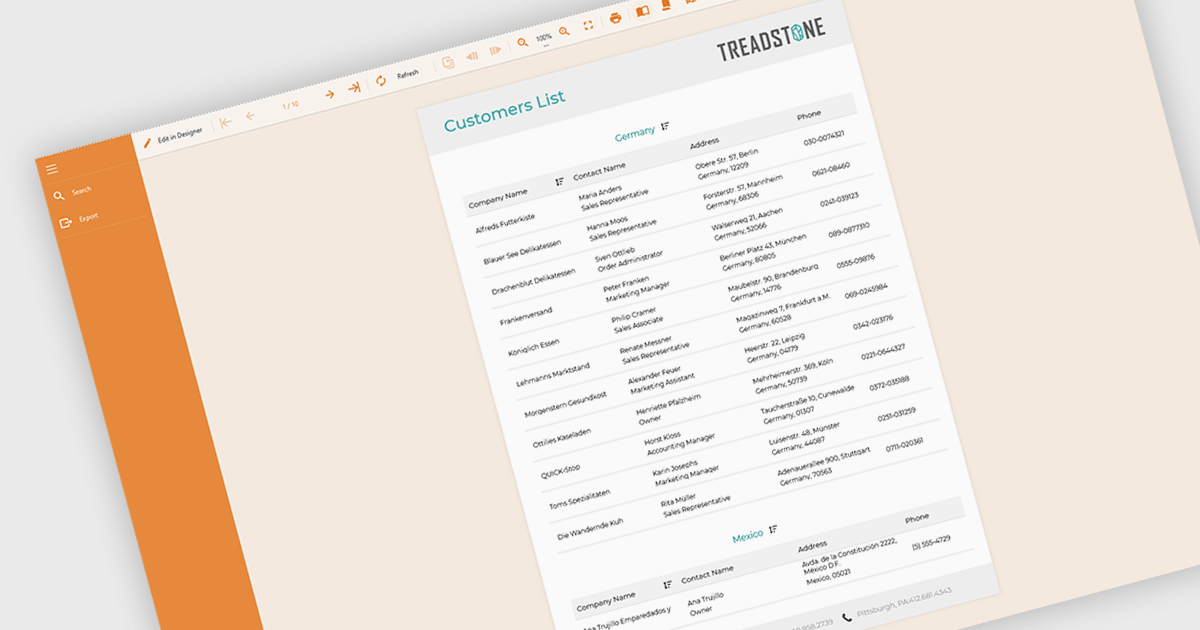
Filtering and grouping report data empowers users to drill down into specific details and identify trends. By filtering data based on relevant criteria, users can isolate subsets of information, while grouping organizes data points based on shared characteristics, allowing for comparisons and pattern recognition within the larger dataset. This combined functionality fosters a deeper understanding of the information being presented.
Several Angular reporting controls offer the ability to filter and group data including:
For an in-depth analysis of features and price, visit our Angular reporting controls comparison.
联系电话: (888) 850 9911
传真: +1 770 250 6199


