


官方供应商
我们作为官方授权经销商,直接提供超过200家开发厂家所发行超过1000个的产品授权给您。
查看我们的所有品牌。
DevExpress WPF is a powerful suite of controls that enhances your WPF development toolkit. It offers data grids, ribbon menus, rich text editors, spreadsheets, charts, and more – all with beautiful themes and touch-friendly interfaces. DevExpress WPF empowers you to build professional-looking, responsive applications that meet modern user expectations, saving you time and effort while adding polish and functionality.
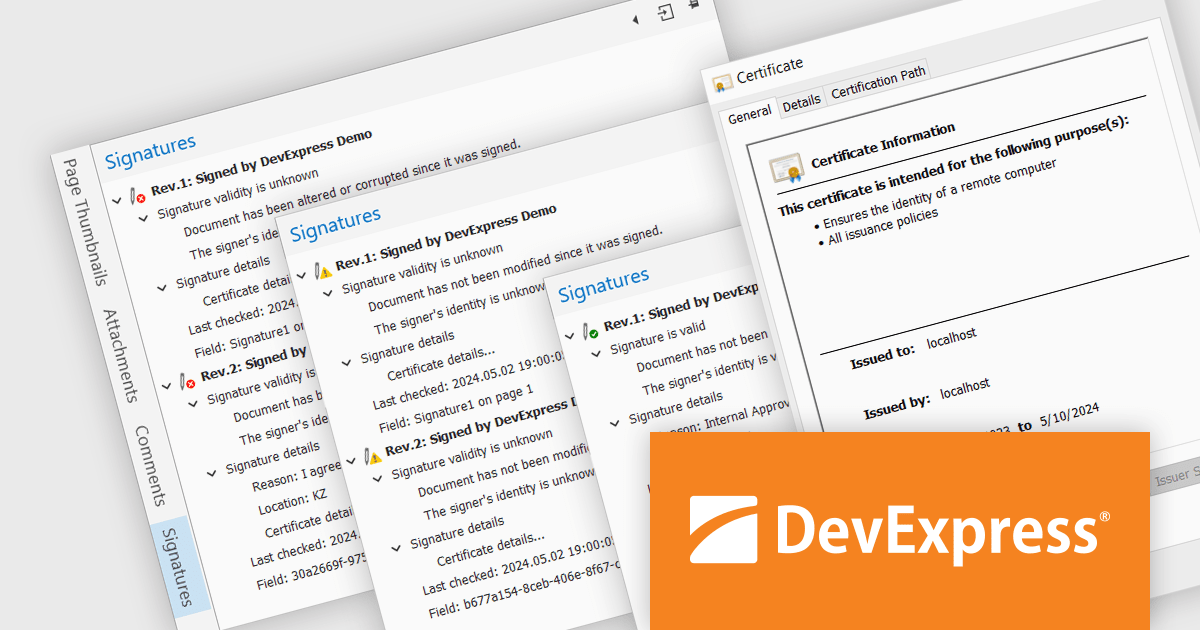
The DevExpress WPF 24.1 update includes a new Signature Info Panel in the PDF Viewer. This feature offers a transparent view of every signature within a PDF, providing detailed information about each signer. The Signature Info Panel goes a step further by intelligently verifying the validity of these signatures in real-time. This instant feedback ensures users can confidently rely on the information presented in the document, saving time and effort.
To see a full list of what's new in version 24.1, see our release notes.
DevExpress WPF is licensed per developer and is available as a Perpetual License with a 12 month support and maintenance subscription. We can supply new subscriptions, subscription renewals, and additional licenses. See our DevExpress WPF licensing page for full details.
DevExpress WPF is available to buy in the following products:
NOV Diagram for .NET by Nevron is a comprehensive and feature-rich diagramming framework designed for .NET developers to create specialized diagramming and drawing applications. Including most of the functionality found in Microsoft Visio, it offers an array of features such as high-performance rendering, a rich set of predefined shapes, automatic layout algorithms, and extensive input/output capabilities. This tool facilitates the integration of complex visualizations directly into WinForms, WPF, Blazor, and Xamarin.Mac projects for developing sophisticated diagramming solutions while maintaining responsiveness and user interactivity.
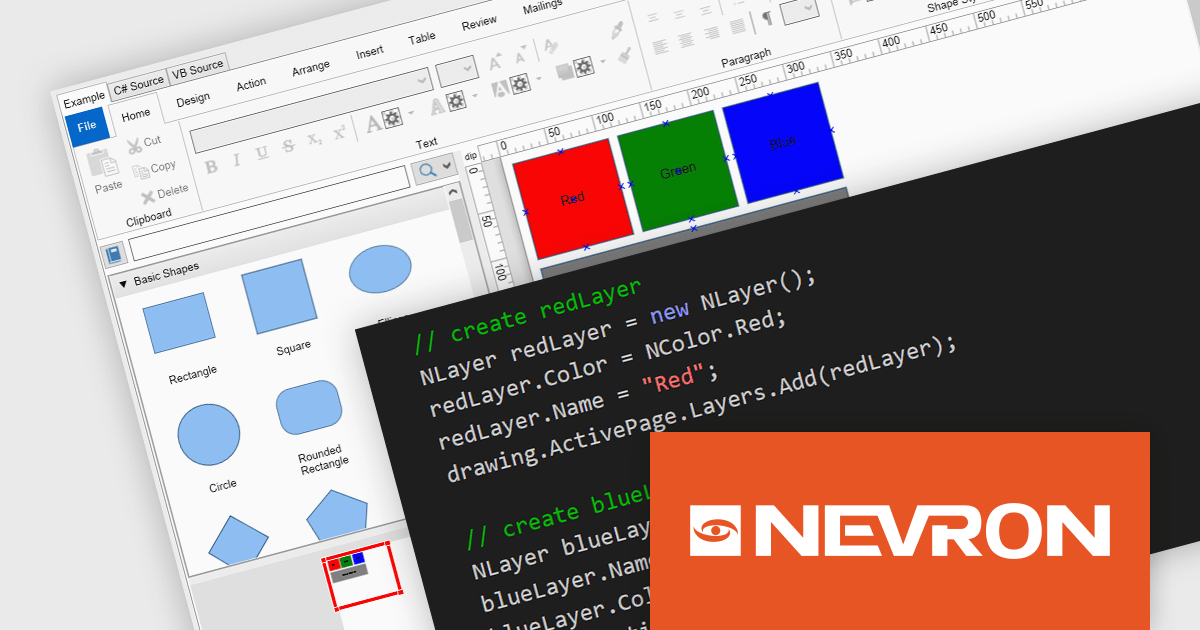
The NOV Diagram for .NET 2024.1 update introduces a new layers feature which gives developers greater control over complex diagram designs. Enabling the segregation of different visual components into distinct layers allows for better organization, making it easier to manage intricate diagrams that require multiple overlapping elements. This functionality means that each page item can now be assigned to a layer, which can be independently manipulated, hidden, or locked without affecting others. This provides a more streamlined workflow and reduces the likelihood of errors during both development and runtime.
To see a full list of what's new in 2024.1, see our release notes.
NOV Diagram for .NET is licensed per developer and is available as a perpetual license with 1 year support and maintenance. See our NOV Diagram for .NET licensing page for full details.
NOV Diagram for .NET is available in the following products:
NOV Chart for .NET by Nevron is a comprehensive .NET charting component suite designed for cross-platform application development. It offers an array of 2D and 3D chart types, along with smart data labeling, an advanced chart axes model, numerous interactivity features and GPU-accelerated real-time rendering based on OpenGL. This library allows developers to seamlessly integrate rich, dynamic and interactive business, scientific, financial and presentation data visualizations into their .NET applications for more effective communication.
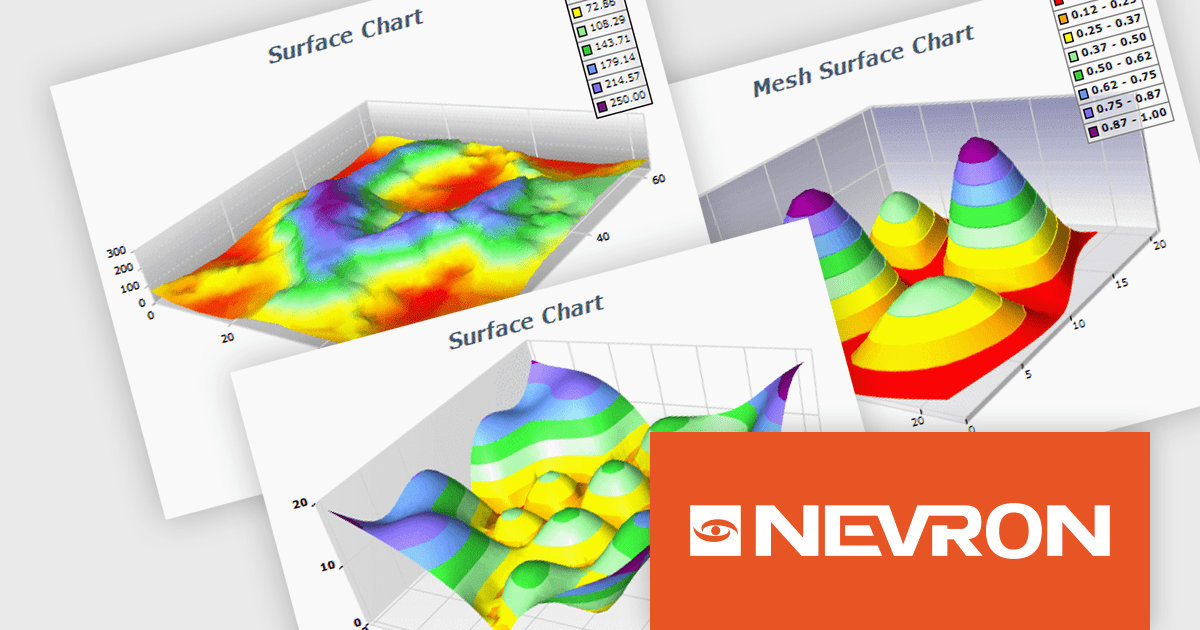
The NOV Chart for .NET 2024.1 update expands its surface series capabilities to include support for Grid Surface, Mesh Surface, Triangulated Surface, and Vertex Surface series types. Supporting custom colors per vertex, mesh and contour lines, flat contour rendering, real time, shader optimized rendering, and more, each series type offers unique capabilities for depicting data. This enables developers to deliver richer, more informative visual analytics, catering to a wide range of professional and scientific needs.
To see a full list of what's new in 2024.1, see our release notes.
NOV Chart for .NET is licensed per developer and is available as a perpetual license with 1 year support and maintenance. See our NOV Chart for .NET licensing page for full details.
NOV Chart for .NET is available in the following products:
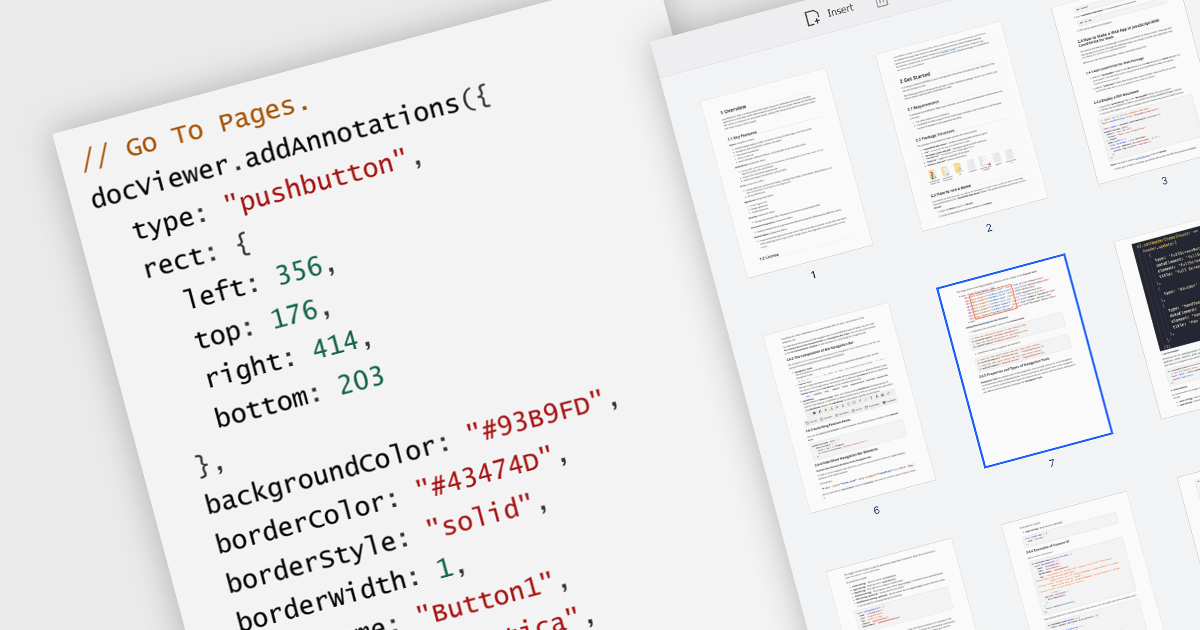
A GoTo action in a PDF component is a clickable link or button that directs users to a specific destination within the same PDF or even a different one. This feature enhances user experience by offering quick jumps to designated parts of the document, references, or connected information. For instance, a table of contents with GoTo actions lets readers instantly access the desired chapter by clicking on the relevant entry. Benefits of the GoTo Action include streamlined document navigation, improved content accessibility, and enhanced interactivity, making it an ideal feature for developing dynamic, user-friendly PDF applications.
Several .NET WPF PDF Components offer GoTo Action including:
For an in-depth analysis of features and price, visit our comparison of .NET WPF PDF Components.
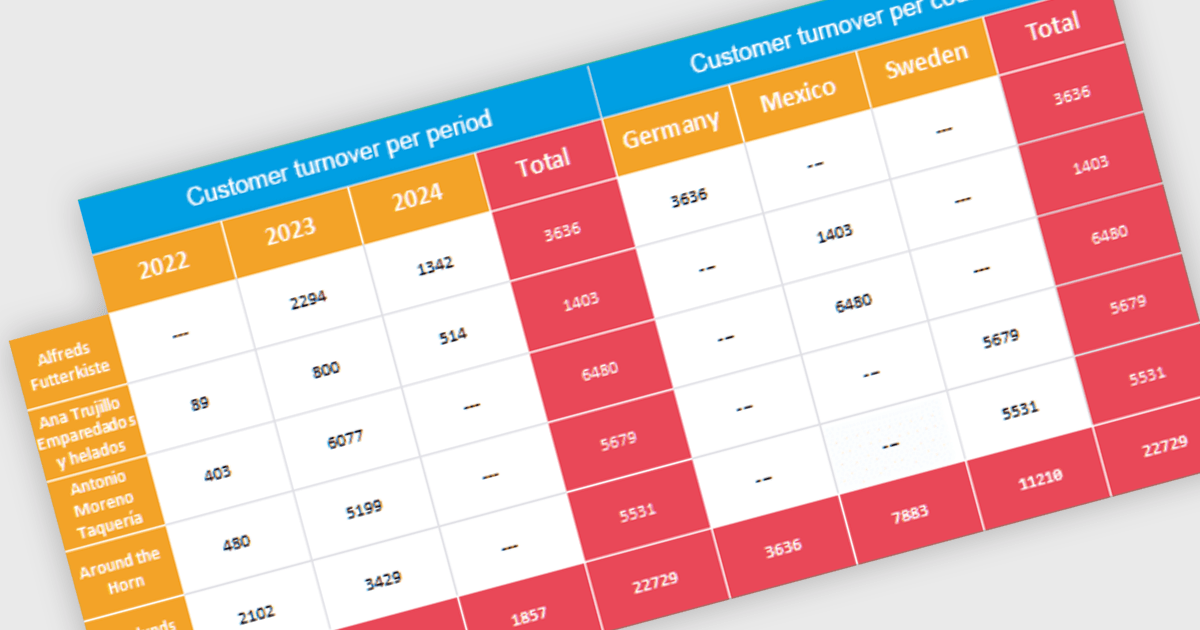
Cross tabs, also known as crosstabulations or contingency tables, are a data visualization technique used in reporting to reveal relationships between two or more categorical variables. By organizing data in a grid with categories on rows and columns, Cross tabs allow users to quickly spot patterns that might not be obvious in standard report formats. This is particularly useful for tasks like understanding user demographics or segmenting customer behavior.
Several .NET WPF Reporting Controls offer cross tabs including:
For an in-depth analysis of features and price, visit our comparison of .NET WPF Reporting Controls.
联系电话: (888) 850 9911
传真: +1 770 250 6199


