













官方供应商
我们作为官方授权经销商,直接提供超过200家开发厂家所发行超过1000个的产品授权给您。
查看我们的所有品牌。
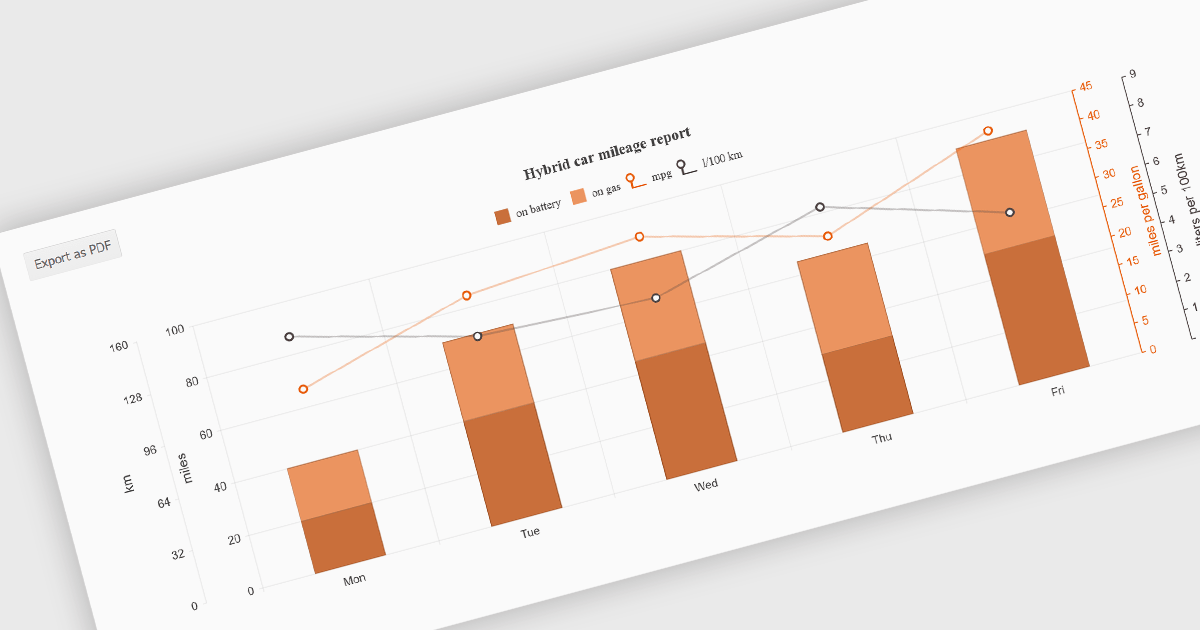
Exporting charts to PDF involves generating a static, portable document version of a chart that preserves its visual structure and data representation. This capability is valuable for reporting, compliance, and sharing insights in a consistent format that does not depend on a live application or browser environment. It allows teams to distribute visual data in a widely accepted file format, ensures layout stability across devices, and supports archival or print-ready use cases without requiring additional tooling.
Several jQuery chart components allow you to export to PDF, including:
For an in-depth analysis of features and price, visit our comparison of jQuery chart components.
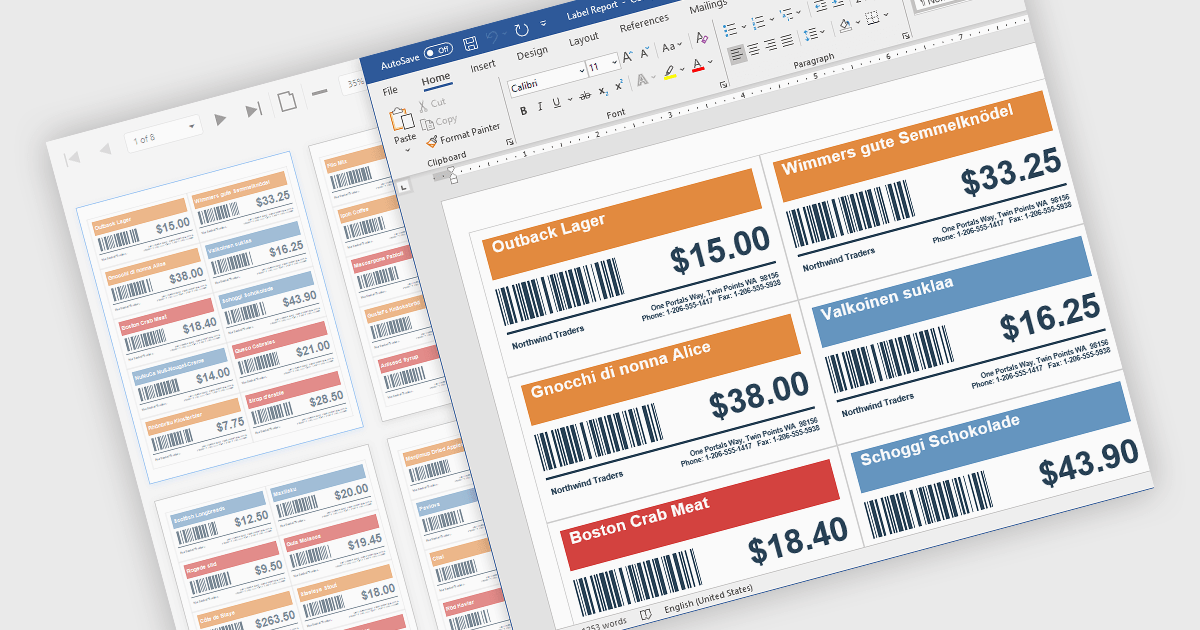
Barcodes in reports involve adding machine readable codes, such as QR codes or linear barcodes, into printed or digital reports to enable quick scanning and automated data capture. This improves accuracy by reducing manual entry, increases efficiency through faster access to information, and supports integration with systems like inventory, CRM, or ERP platforms. It also enhances traceability for tracking items, documents, or transactions. Common use cases include inventory management, order processing, healthcare records, and invoice or ticket verification where speed and reliability are essential.
Several .NET WinForms Reporting controls include Barcodes including:
For an in-depth analysis of features and price, visit our comparison of .NET WinForms Reporting Controls.
PHP turns 31 this June, and JetBrains is marking it with PHPverse 2026—a free, live-streamed event focused on modern PHP and its future. This all-day event begins at 7:00 AM EDT (13:00 CET) on June 9th, 2026. This year’s lineup includes speakers like Jeffrey Way, Fabien Potencier, Jonathan Bossenger, and Elizabeth Barron. PHPverse gives you the opportunity to:
Join for the full day or just the sessions you care about.
Register now and mark your calendar for June 9th, 2026.
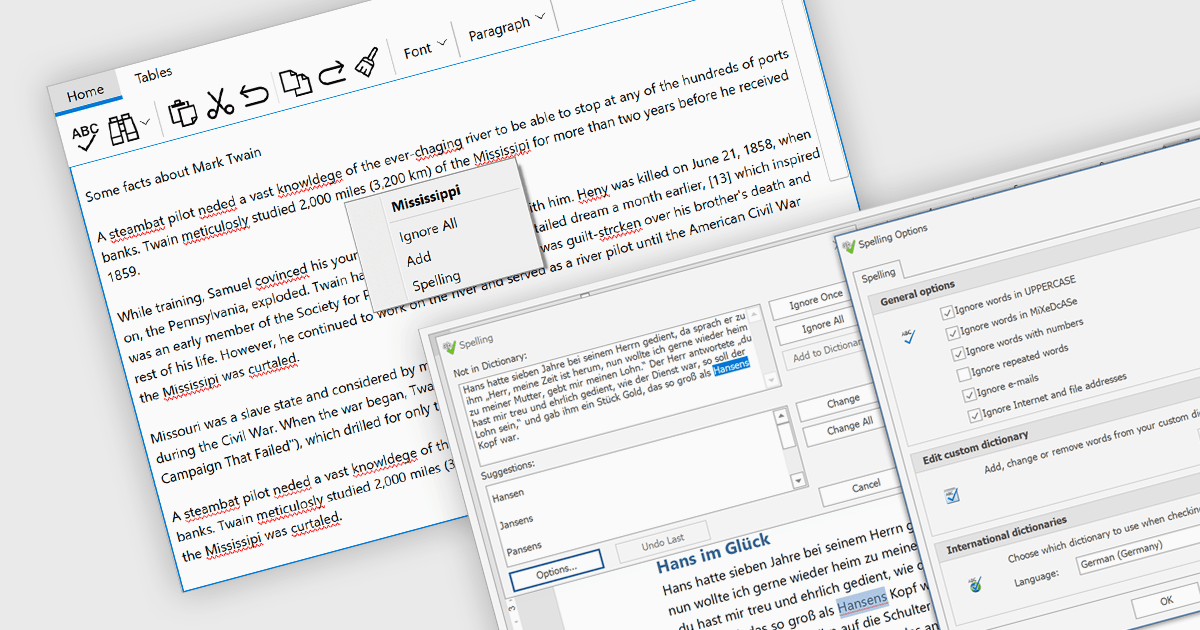
Spell checker components are reusable software modules that provide automated spelling validation within applications, typically integrated into text editors, data entry forms, or rich text controls. They use dictionaries and optional user-defined vocabularies to identify and suggest corrections for misspelled words, either in real time or during batch processing, with some implementations also incorporating language-specific rules. The primary benefits include improved data accuracy, enhanced user experience, and reduced manual proofreading effort, particularly in applications that rely heavily on text input such as document management systems, messaging tools, and reporting interfaces.
Several WinForms UI suites provide you with spell checker components, including:
For an in-depth analysis of features and price, visit our comparison of WinForms UI suites.
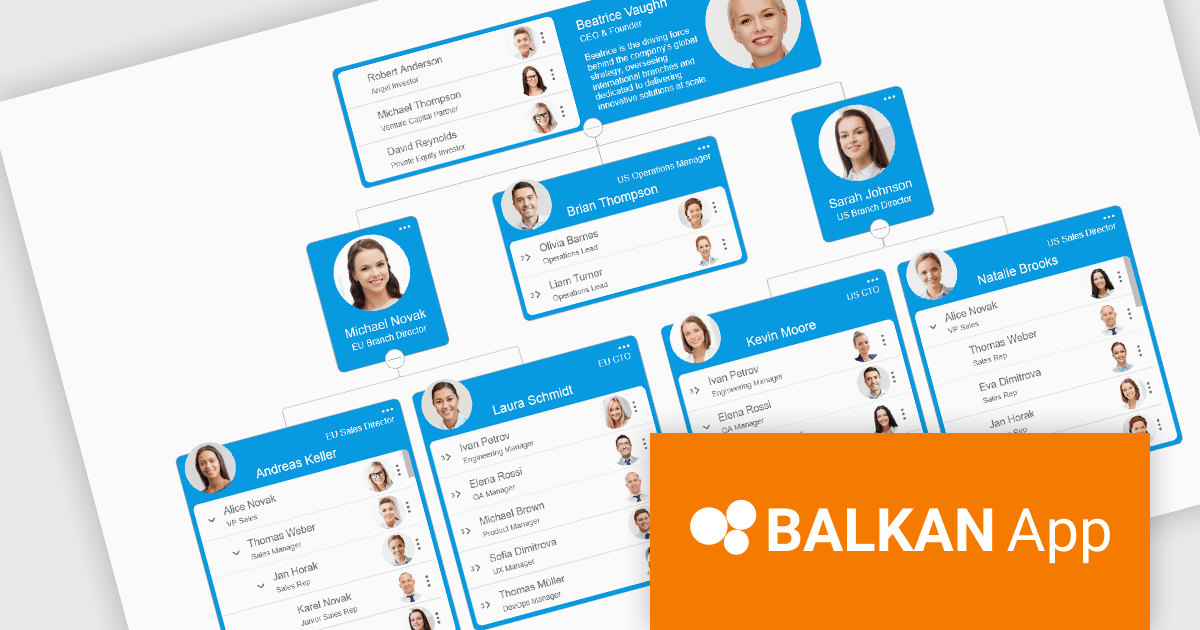
OrgChart JS by BALKAN App is a JavaScript library designed for creating flexible, interactive and customizable organizational charts for presenting structural data. This visual tool helps managers illustrate the roles and hierarchy of an organization, supporting a variety of features, including grouping, assistant nodes, expand/collapse, a built-in search field, and multi-format exports for example to PDF, PNG, SVG or CSV. Compatible with all modern browsers, it supports thousands of nodes without any impact on performance, and offers extensive customization, giving users a versatile and efficient tool for visualizing hierarchical data structures in web applications.
OrgChart JS includes the Tree List Layout, offering a space-efficient and readable way to represent hierarchical data by combining a tree structure with a linear list, enabling developers to display deeply nested hierarchies without the horizontal sprawl of traditional node-link diagrams. It allows nodes to be expanded and collapsed within a vertically aligned list, improving navigation and scalability while maintaining parent-child relationships, and supporting extensive nesting without compromising usability. This makes it particularly useful in scenarios with limited screen space or large datasets, where reducing visual complexity while preserving the full hierarchy is essential, such as administrative dashboards and data management interfaces.
OrgChart JS is licensed based on usage, offering single website, unlimited websites or SaaS, and OEM licenses. It is available as a perpetual license with 1 year maintenance and technical support. See our OrgChart JS licensing page for full details.
For more information, see our OrgChart JS product page.
联系电话: (888) 850 9911
传真: +1 770 250 6199


