













官方供应商
我们作为官方授权经销商,直接提供超过200家开发厂家所发行超过1000个的产品授权给您。
查看我们的所有品牌。
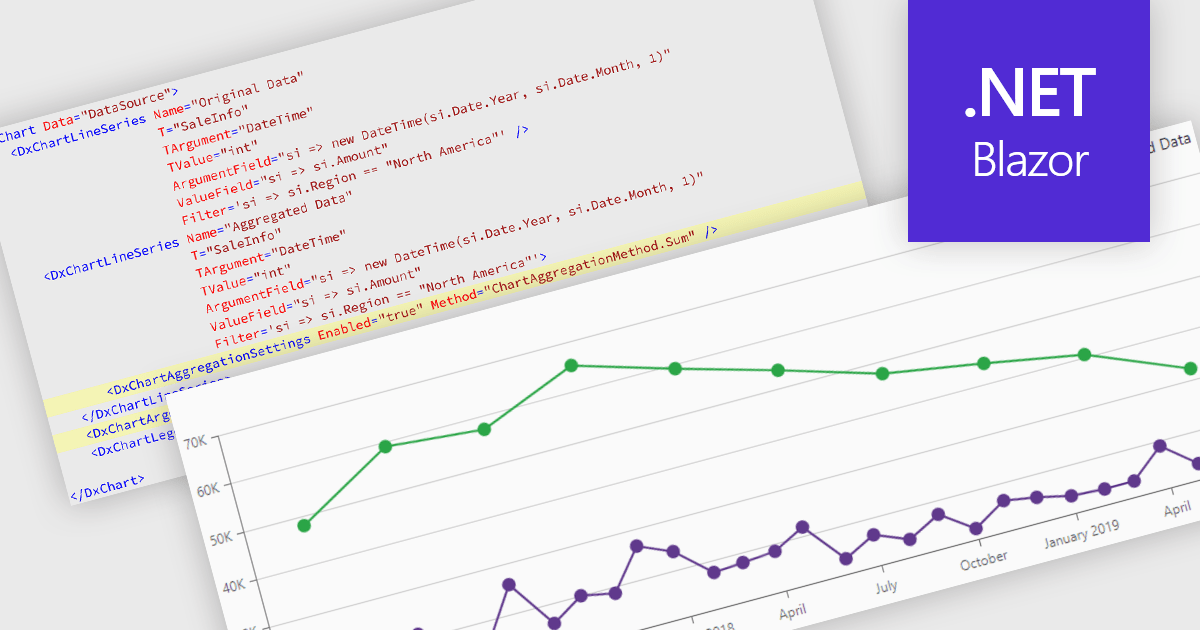
Data aggregation in chart components improves the readability and performance of data visualizations by combining multiple data points into larger, meaningful groups. This enables applications to present large or high-frequency datasets more effectively, reducing visual clutter while preserving overall trends and patterns. Aggregation can be applied dynamically based on the displayed range or selected interval, allowing users to explore data at different levels of detail without compromising responsiveness.
Several Blazor charting controls support data aggregation including:
For an in-depth analysis of features and price, visit our Blazor charting controls comparison.
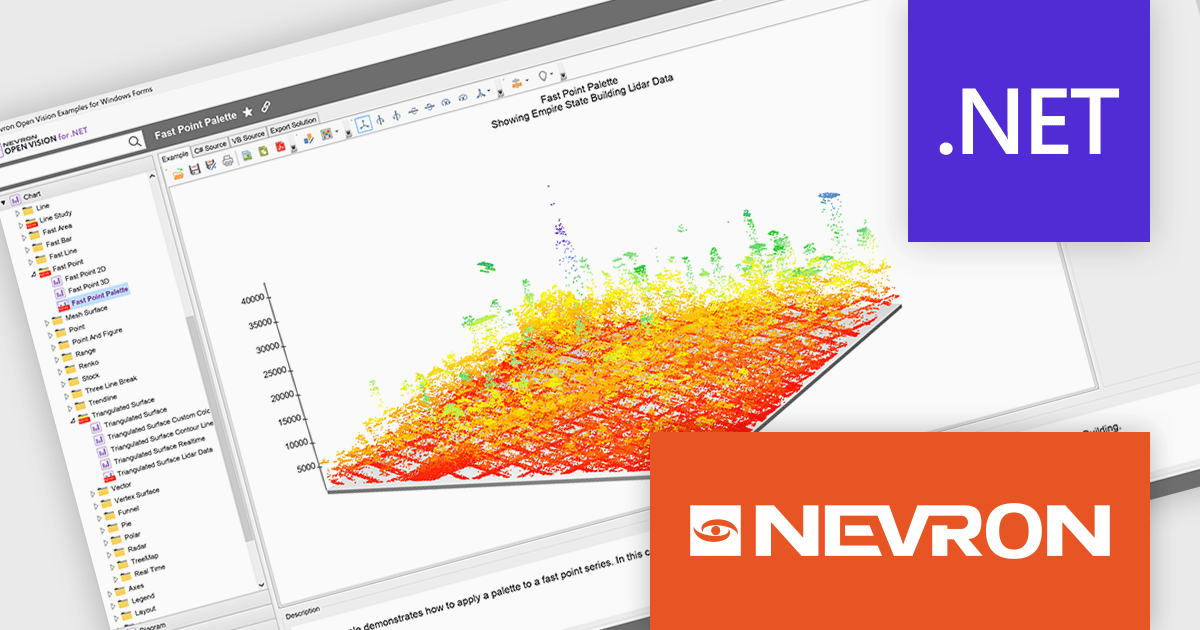
NOV Chart for .NET by Nevron is a comprehensive .NET charting component suite designed for cross-platform application development. It offers an array of 2D and 3D chart types, along with smart data labeling, an advanced chart axes model, numerous interactivity features and GPU-accelerated real-time rendering based on OpenGL. This library allows developers to seamlessly integrate rich, dynamic and interactive business, scientific, financial and presentation data visualizations into their .NET applications for more effective communication.
The NOV Chart for .NET 2026.1 update introduces a new Palette Fill Mode for Fast Area, Fast Bar, Fast Line, and Fast Point Series, giving developers greater control over how colors are applied across high performance charts. This enhancement makes it easier to create visually consistent and professionally styled data visualizations while reducing the effort required to maintain a unified appearance across multiple chart types. The added flexibility helps developers produce clearer dashboards, reporting interfaces, and analytics applications that better align with application branding and design requirements.
To see a full list of what's new in 2026.1, see our release notes.
NOV Chart for .NET is licensed per developer and is available as a perpetual license with 1 year support and maintenance. See our NOV Chart for .NET licensing page for full details.
NOV Chart for .NET is available in the following products:
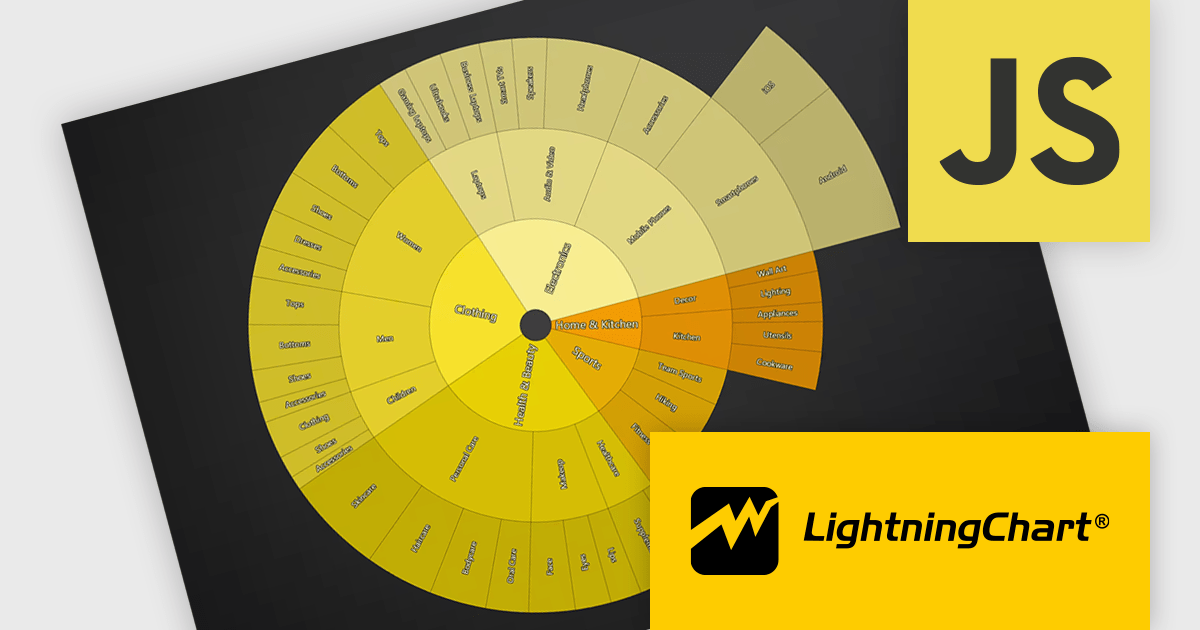
LightningChart JS is a high-performance JavaScript charting library that utilizes WebGL rendering and GPU acceleration to deliver exceptional performance for a wide range of data visualization needs. It is designed to handle large datasets and complex visualizations with ease, enabling developers to create interactive and visually appealing 2D and 3D charts. Ideal for applications demanding smooth real-time data updates, such as financial platforms, engineering tools, scientific research dashboards, and industrial monitoring systems, LightningChart JS provides a comprehensive API for customization and integration into web-based projects.
The LightningChart JS v8.3 update introduces Sunburst charts, enabling developers to visualize hierarchical data in a compact and intuitive format that clearly represents part to whole relationships across multiple levels. By displaying nested categories as proportionally sized segments within concentric rings, the chart makes it easier to analyze complex data structures, compare contributions at different hierarchy levels, and identify patterns or dominant categories without requiring multiple visualizations. This helps developers deliver more informative data exploration experiences in applications that rely on organizational, financial, operational, or other structured datasets.
To see a full list of what's new in v8.3, see our release notes.
LightningChart JS is licensed per developer and is available as an annual license with 1 year support. See our LightningChart JS licensing page for full details.
For more information, see our LightningChart JS product page.
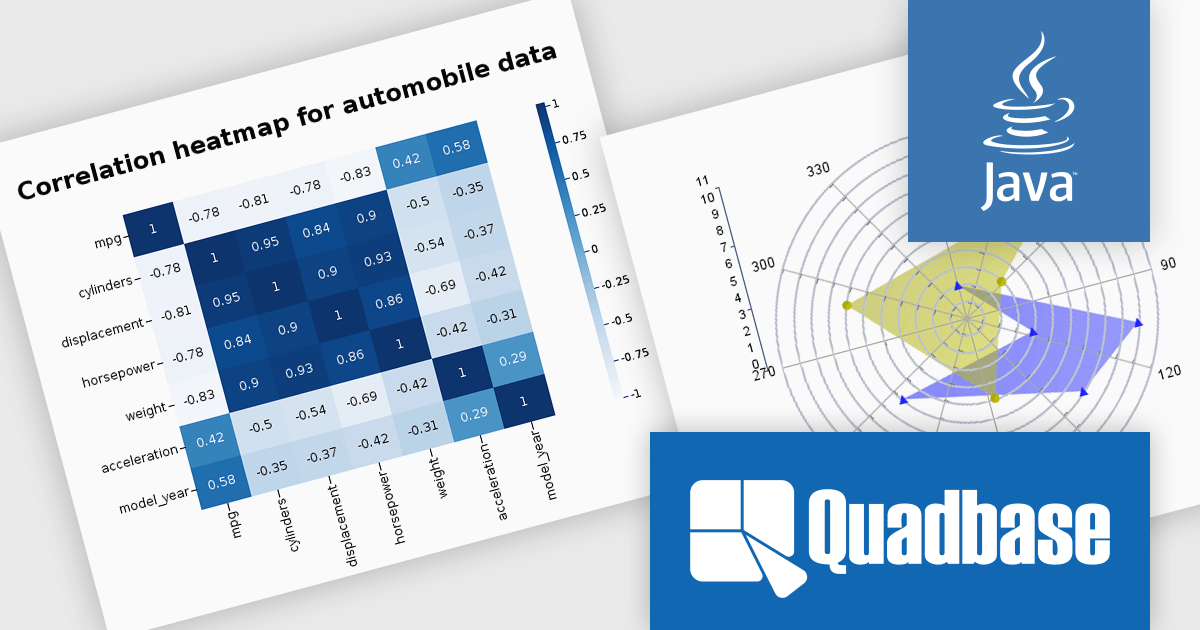
EspressChart is a Java-based business intelligence and data visualization solution that enables organizations to create and deploy interactive, highly customizable charts for web and enterprise applications. With its robust API and intuitive Chart Designer, users can easily build visualizations featuring advanced capabilities such as drilldown, parameterization, and statistical analysis. Supporting multiple output formats, including PNG, JPEG, GIF, PDF, WMF, and SVG, EspressChart integrates seamlessly into applications and dashboards, helping businesses transform complex data into clear insights for reporting, analytics, and informed decision-making.
The EspressChart 7.2 update modernizes the charting and data visualization platform by introducing support for Jakarta EE 11, JDK 21, and Tomcat 11. For developers building reporting, dashboard, and business intelligence applications, this provides access to the latest enterprise Java standards and runtime technologies, enabling easier integration, improved application performance, and greater deployment flexibility. The update helps ensure that EspressChart based solutions remain compatible with modern Java environments while simplifying platform upgrades and reducing reliance on legacy infrastructure.
To see a full list of what's new in v7.2, see our release notes.
EspressChart is licensed on a per machine basis, with separate Development and Server/Deployment licenses available to support both application development and production deployment. See our EspressChart licensing page for full details.
For more information, see our EspressChart product page.
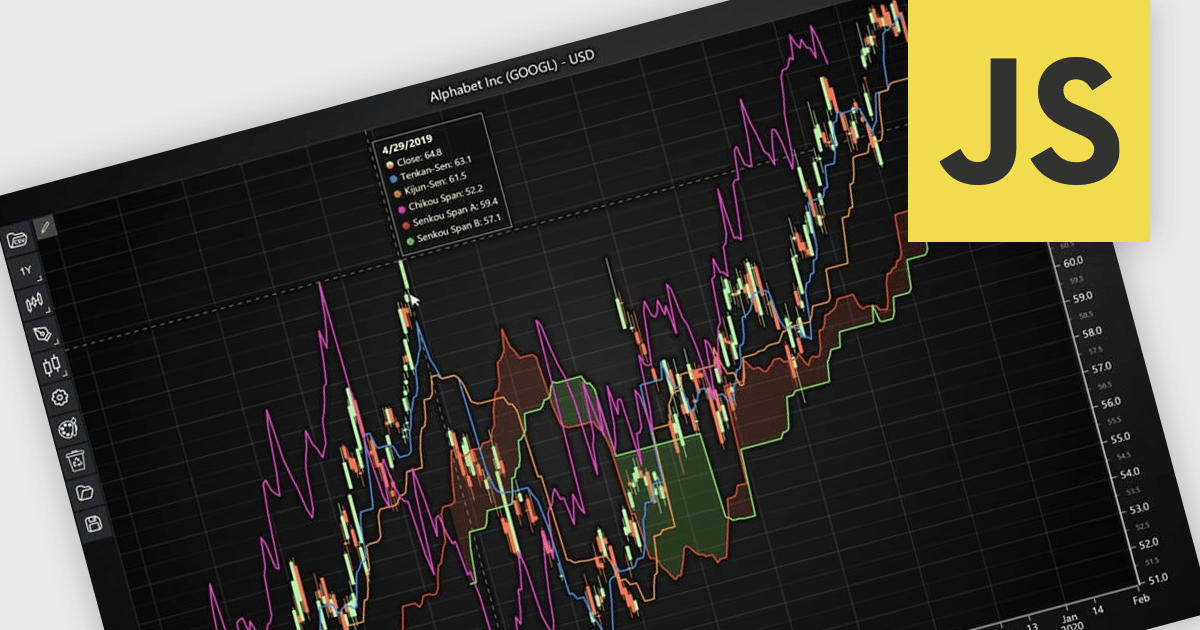
Chart indicators are tools that display calculated data on a chart to help users identify trends, measure momentum, recognize support and resistance levels, and spot potential reversals. By presenting complex market data as clear visual signals, they simplify analysis, support faster decision making, and help users uncover opportunities. Common use cases include tracking trend strength, confirming entry and exit points, and identifying key price levels where market direction may change.
Several JavaScript charting components provide support for indicators within financial charts, including:
For an in-depth analysis of features and price, visit our JavaScript chart components comparison.
联系电话: (888) 850 9911
传真: +1 770 250 6199


