













官方供应商
我们作为官方授权经销商,直接提供超过200家开发厂家所发行超过1000个的产品授权给您。
查看我们的所有品牌。

LightningChart JS Trader is a JavaScript/TypeScript library developed by LightningChart that specifically targets the creation of financial and trading applications. It provides high-performance, 2D, 3D, and real-time charting controls and a comprehensive suite of visualizations including candlestick, bar, line, and various technical indicators and drawing tools. This library enables software developers to create interactive technical analysis tools without the need for server-side setup as it runs completely on the client device.
The LightningChart JS Trader v4.0 update introduces a latest price labels feature which automatically displays the most recently received price and indicator values on the Y-axis, giving developers a clear reference point without implementing custom annotations. This built-in functionality reduces development effort by handling label placement and synchronization with incoming data, while configurable options allow teams to show the label, the horizontal line, both, or neither depending on the requirements of their application. As a result, developers can deliver a cleaner, more informative charting experience that makes it easier for end users to quickly interpret current market levels and indicator states.
To see a full list of what's new in v4.0, see our release notes.
LightningChart JS Trader is licensed per developer and is available as an annual license with 1 year support. See our LightningChart JS Trader licensing page for full details.
For more information, see our LightningChart JS Trader product page.
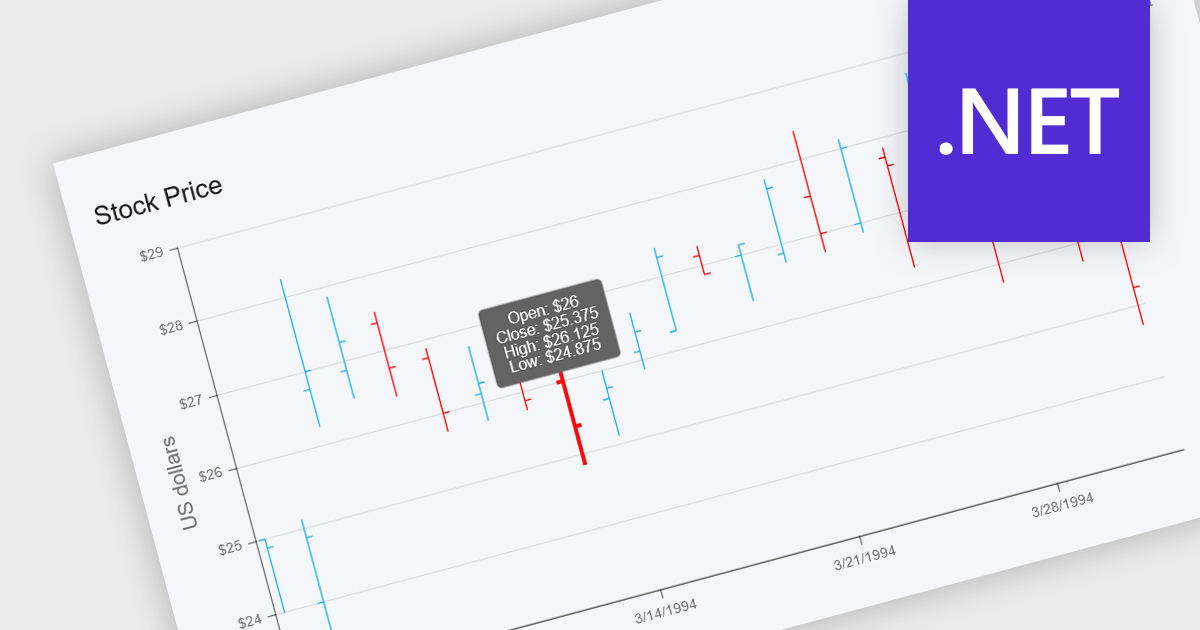
OHLC charts, short for Open-High-Low-Close charts, are a type of financial chart used to represent price movements of assets over a specific time period. Each point on the chart summarizes a single period's opening, highest, lowest, and closing prices, typically displayed using vertical bars with ticks to indicate opening and closing values. This format offers a clear and compact way to visualize volatility and market trends within a given timeframe. For developers and analysts working with financial data, OHLC charts are especially valuable for identifying price patterns, monitoring market behavior, and making informed decisions based on historical performance.
Several .NET chart components offer OHLC charts, including:
For an in-depth analysis of features and price, visit our comparison of .NET chart components.
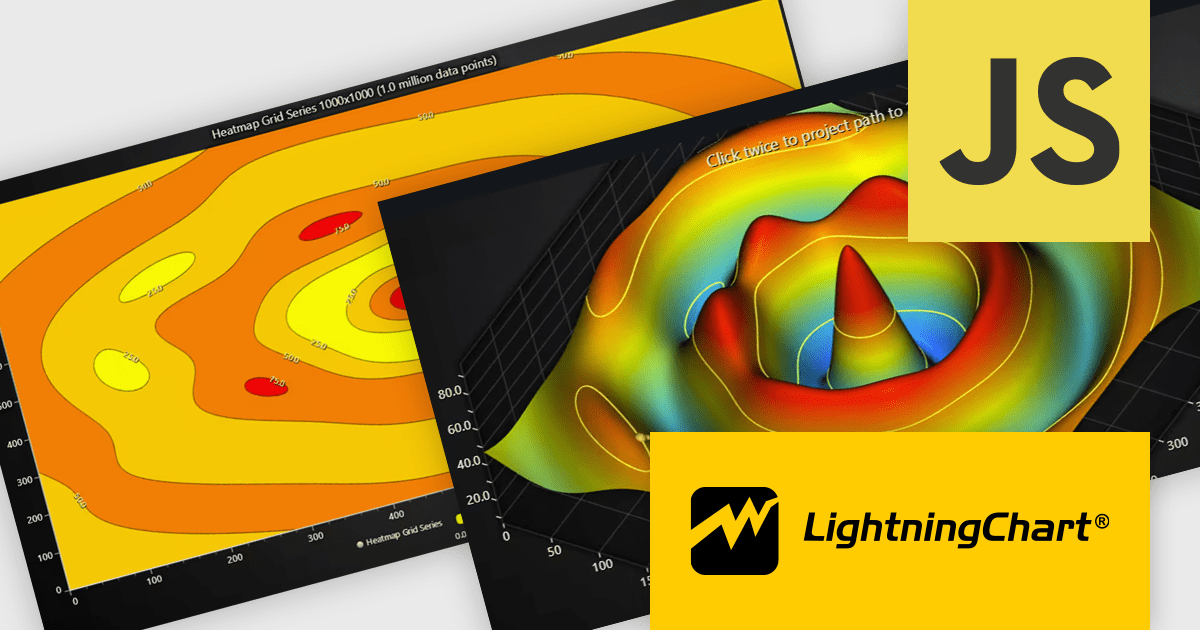
LightningChart JS is a high-performance JavaScript charting library that utilizes WebGL rendering and GPU acceleration to deliver exceptional performance for a wide range of data visualization needs. It is designed to handle large datasets and complex visualizations with ease, enabling developers to create interactive and visually appealing 2D and 3D charts. Ideal for applications demanding smooth real-time data updates, such as financial platforms, engineering tools, scientific research dashboards, and industrial monitoring systems, LightningChart JS provides a comprehensive API for customization and integration into web-based projects.
The LightningChart JS v8.1 update introduces built-in contour rendering for heatmap and surface charts, giving developers a straightforward way to highlight value transitions and gradients within complex datasets. The new contour capabilities automatically generate level lines and labels, while offering control over stroke and text styling for each contour level. This improves the clarity and interpretability of dense numerical data, reduces the need for custom rendering logic, and maintains high performance even when working with detailed datasets.
To see a full list of what's new in v8.1, see our release notes.
LightningChart JS is licensed per developer and is available as an annual license with 1 year support. See our LightningChart JS licensing page for full details.
For more information, see our LightningChart JS product page.

Live data support for charts enables visualizations to update automatically as new information arrives, turning static dashboards into continuously refreshed, real-time views. This reduces reliance on manual refreshes or scheduled reports and helps prevent decisions based on stale data. Teams gain immediate insight into changing conditions, spotting anomalies, performance issues, or opportunities as they emerge. Typical use cases include monitoring website traffic, application performance, financial markets, IoT sensors, and business KPIs such as orders, revenue, or support queues. By making current metrics instantly visible, live charts improve responsiveness, operational control, and confidence in data-driven decisions and outcomes across the organization.
Several React chart controls support live data including:
For an in-depth analysis of features and price, visit our React chart controls comparison.

A scatter chart is a visual tool that displays relationships between two variables by plotting data points on an X and Y axis. Each point represents a value pair, helping users quickly identify patterns, correlations, and outliers within complex datasets. Scatter charts effectively highlight trends, clusters, and anomalies that might not be visible in tables. With customizable markers, colors, and sizes, they clearly differentiate data groups. Common use cases include analyzing sales versus marketing spend, comparing temperature and energy use, or assessing customer satisfaction relative to pricing. This turns raw data into clear and actionable visual insights.
Several JavaScript chart controls offer scatter charts including:
For an in-depth analysis of features and price, visit our JavaScript chart controls comparison.
联系电话: (888) 850 9911
传真: +1 770 250 6199


