













官方供应商
我们作为官方授权经销商,直接提供超过200家开发厂家所发行超过1000个的产品授权给您。
查看我们的所有品牌。
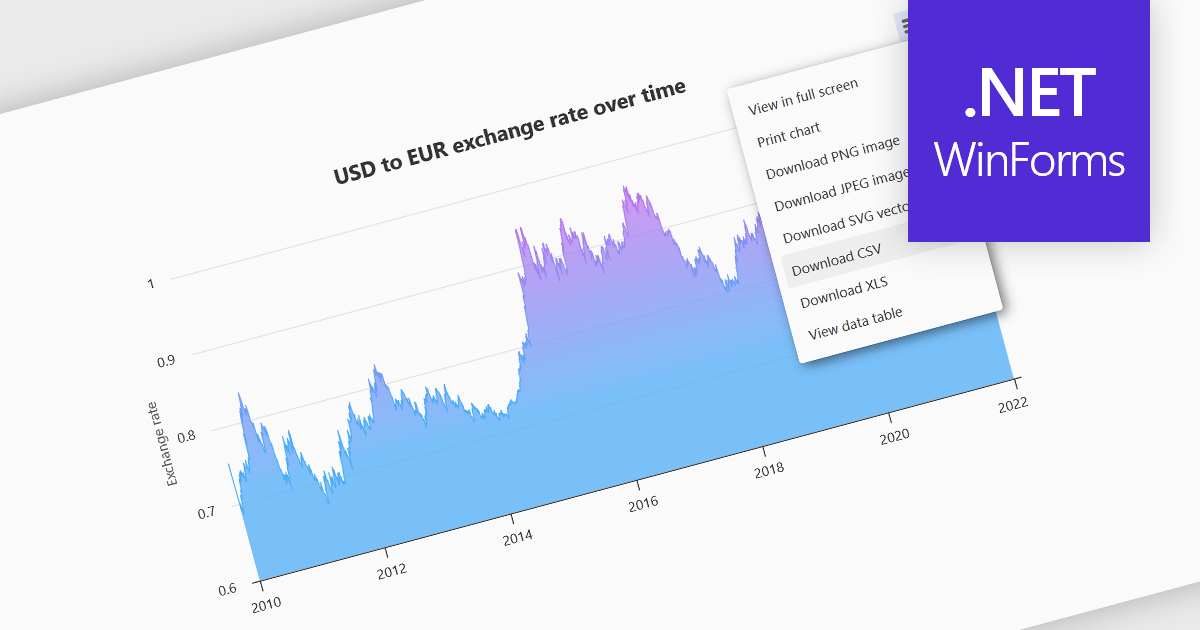
Exporting charts to CSV (Comma-Separated Values) allows users to extract underlying chart data into a simple, portable text format that can be easily opened in spreadsheet applications or processed by other tools. This feature is particularly useful for reporting, data analysis, auditing, and integration apps, as it decouples the visual presentation of data from the raw numerical or categorical information it represents. By enabling quick access to chart data in a structured format, exporting to CSV enhances interoperability across systems and supports a wider range of use cases.
Several WinForms charting components allow you to export to CSV, including:
For an in-depth analysis of features and price, visit our comparison of WinForms chart components.
Highcharts is a JavaScript charting framework that allows web developers and data analysts to generate dynamic, visually appealing charts and graphs for websites and web applications. It can display a variety of chart types, including line, spline, area, column, bar, pie, scatter, and many more. Highcharts is well-known for its ease of use, rich documentation, and ability to handle huge datasets efficiently. Features include responsive design, accessibility support, and cross-browser compatibility. Its customization capabilities allow users to create bespoke data visualizations that increase engagement and provide insightful data presentations.
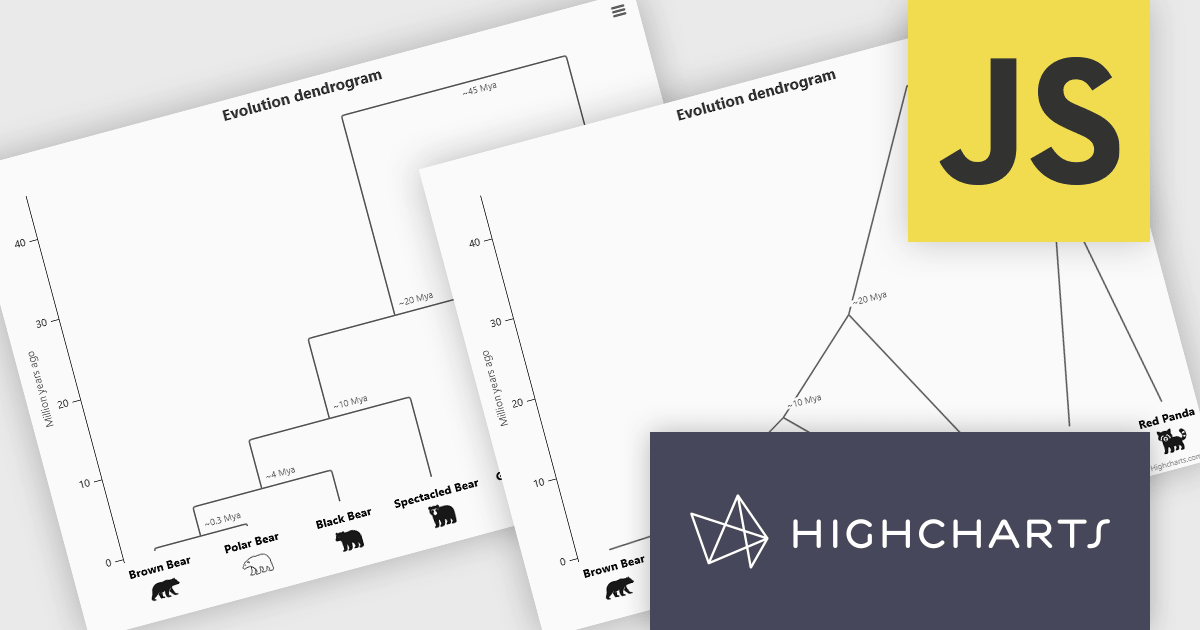
The Highcharts 12.5 update introduces dendrogram support, allowing developers to visualize hierarchical relationships and similarity levels directly within their charts using treegraph-based diagrams. This enhancement makes it easier to represent the output of hierarchical clustering algorithms, taxonomies, and other structured datasets in a clear and interpretable way. By mapping similarity or progression along an axis and using branch height to indicate relationships, developers can present complex hierarchical data more effectively.
To see a full list of what's new in 12.5, see our release notes.
Highcharts Core is licensed on an annual or perpetual basis, OEM licenses, and Advantage Renewals. It is licensed per Developer and has several license options including Internal, SaaS, SaaS+, and Self Hosted. See our Highcharts Core licensing page for full details.
Learn more on our Highcharts Core product page.
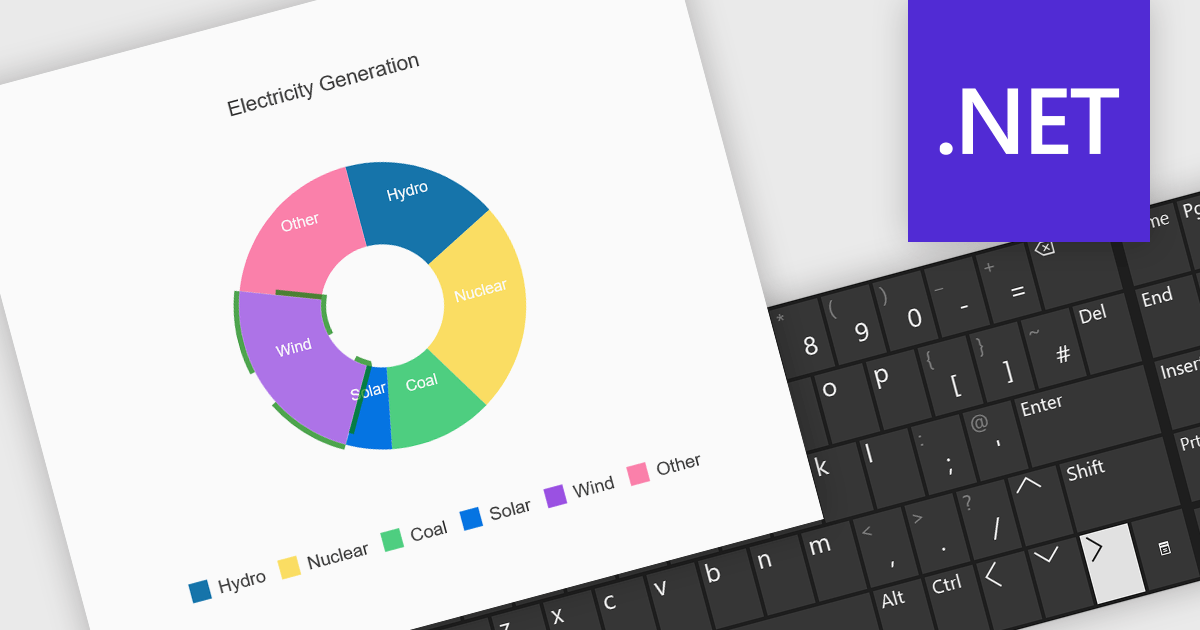
Charts with keyboard navigation support are designed to improve accessibility and usability by allowing users to explore chart data using only the keyboard. This feature is especially valuable for users who rely on assistive technologies or prefer keyboard interaction over a mouse. It typically includes capabilities like navigating between data points, series, or chart elements using arrow keys, accessing tooltips or data labels, and sometimes triggering events like selection or focus changes, all through the keyboard.
Several .NET chart components support keyboard navigation, including:
For an in-depth analysis of features and price, visit our comparison of .NET chart components.

Chart zooming allows users to interactively adjust the visible range of a chart to focus on specific data points, time periods, or value ranges for closer analysis. By enabling users to zoom in and out dynamically, it reduces visual clutter, improves clarity, and helps uncover trends, anomalies, or patterns that may be difficult to identify at a full-scale view. This interactive capability supports faster, more informed decision-making by allowing movement between high-level overviews and detailed insights without reloading data. Common use cases include analyzing financial performance over specific timeframes, investigating spikes or drops in operational metrics, reviewing detailed sensor or monitoring data, and highlighting key data segments during presentations or stakeholder reviews.
Several JavaScript chart controls support zooming including:
For an in-depth analysis of features and price, visit our comparison of JavaScript Charts.
Codejock Toolkit Pro is a comprehensive suite of UI components designed to improve the development process and create visually appealing, feature-rich applications. The toolkit offers a wide range of controls, including calendars, charts, docking windows and more, each meticulously crafted to provide exceptional performance and customization options. With features like data binding, theming and localization, developers can easily integrate the toolkit into their projects and tailor the interface to meet specific requirements. The toolkit's versatility makes it suitable for various applications, from desktop software to web-based solutions, helping developers to deliver professional-grade user experiences.
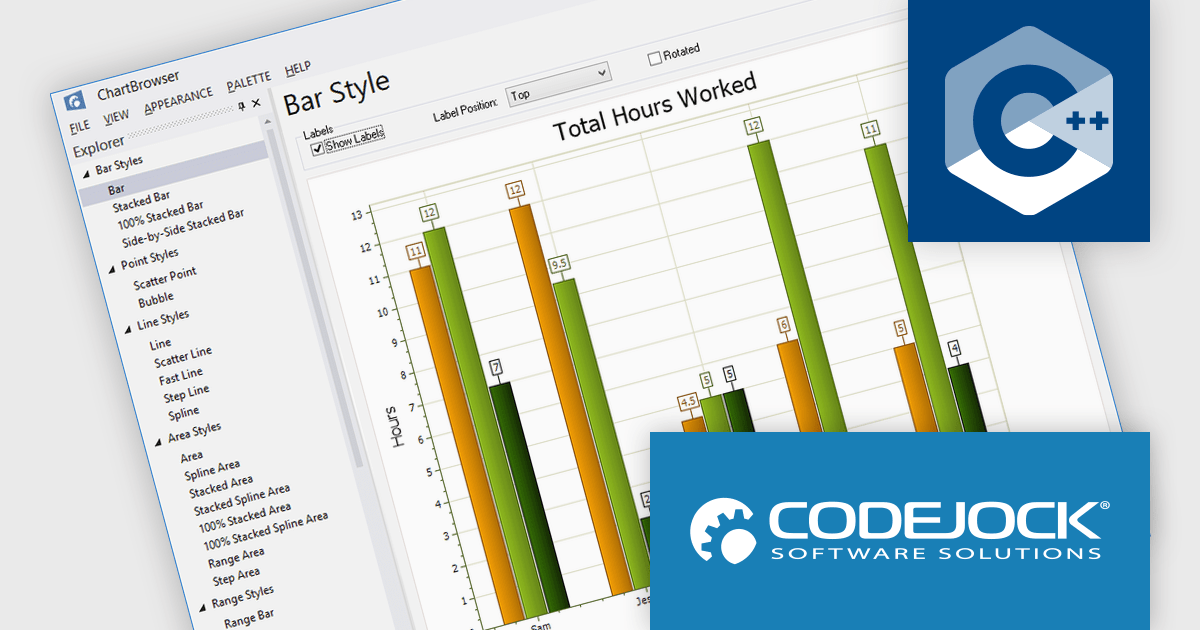
Codejock Toolkit Pro delivers a comprehensive charting framework that enables software developers to visualize, analyze, and communicate complex data effectively within Windows applications. It supports a broad range of chart types, from standard bar and line charts to specialized financial, Gantt, and analytical visualizations, allowing developers to select the most appropriate format for each data scenario. The charting controls offer extensive customization over layout, styling, axes, labels, and interaction, making it possible to align visuals with application requirements and branding. With a well-structured API and proven performance, the framework reduces the need for custom charting logic, shortens development time, and helps ensure that data-driven features remain maintainable, consistent, and reliable over time.
Codejock Toolkit Pro is licensed per developer and is available as a perpetual license with 30 days or 1 year subscription (product updates and phone/email technical support). See our Codejock Toolkit Pro licensing page for full details.
For more information, visit our Codejock Toolkit Pro product page.
联系电话: (888) 850 9911
传真: +1 770 250 6199


