













官方供应商
我们作为官方授权经销商,直接提供超过200家开发厂家所发行超过1000个的产品授权给您。
查看我们的所有品牌。
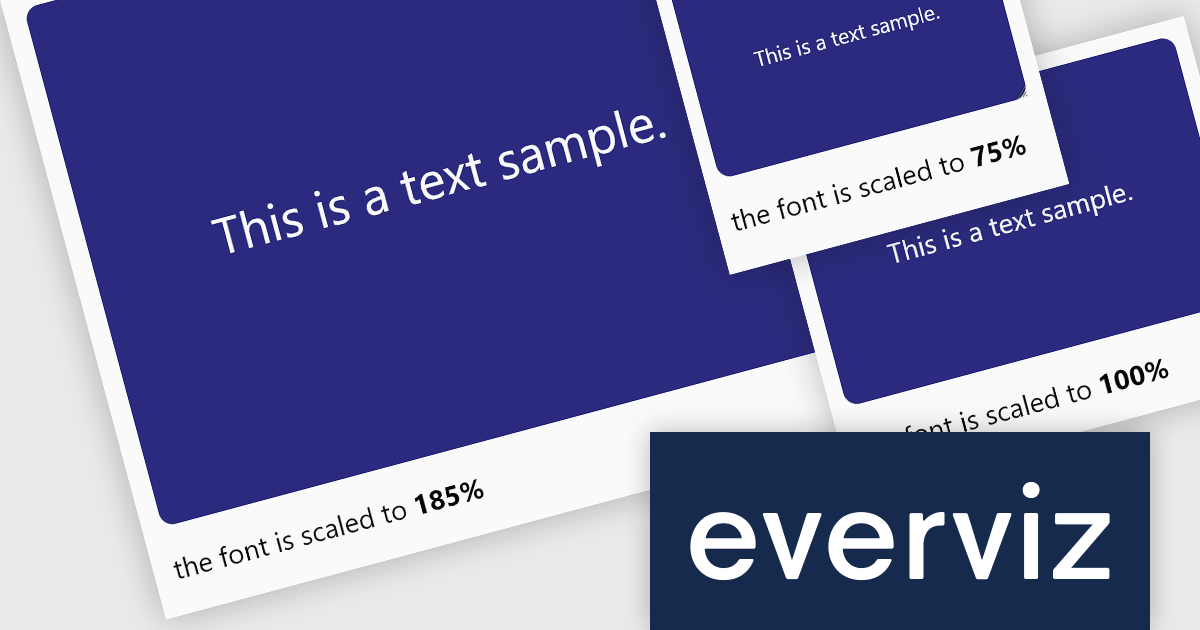
everviz is a cloud-based data visualization platform that empowers users to create visually appealing interactive charts, maps, and other visuals.
The October 2023 update of everviz adds a new dynamic font scaling feature. This allows chart text to be intelligently resized to fit your publishing destination, whether it's intended for print, video, or the web. It is particularly useful when exporting visualizations in video format, where the text size requirements are significantly different from those of an online article. Dynamic font scaling helps maintain a consistent visual quality across your visualizations.
To see a full list of what's new, see our release notes.
For more information, see our everviz product page.
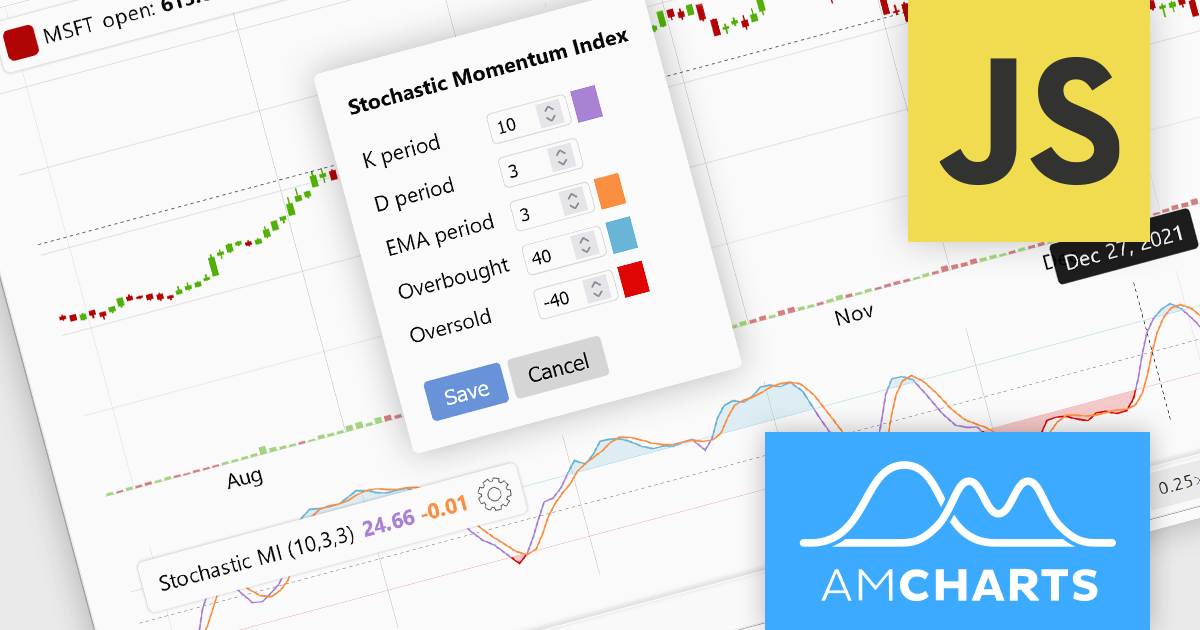
amCharts 5: Stock Chart provides analytical tools for displaying time-based data, be it financial, stock or otherwise. It is a ready-made library that allows you to add interactive financial charts to a vast array of applications.
amCharts v5.5.3 adds built-in support for the Stochastic Momentum Index (SMI) to its bundled indicator control, allowing you to add the SMI to your charts via a simple user interface. This indicator reduces false signals by measuring the distance between the current closing price and the midpoint of the high/low price range. The SMI is a valuable technical indicator that can help traders identify potential trend reversals, capture momentum shifts, and make more informed trading decisions. Adding the SMI to your stock charts can help users gain a competitive edge in the market.
To see a full list of what's new in v5.5.3, see our release notes.
For more information, see our amCharts 5: Stock Chart product page.
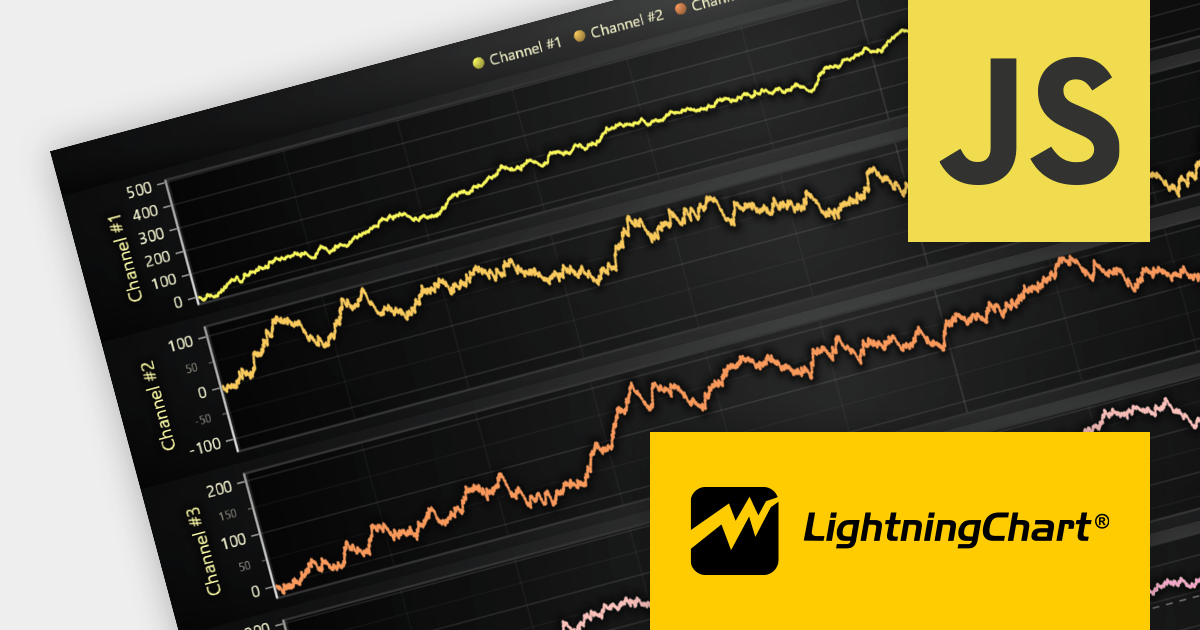
LightningChart JS is a high-performance JavaScript charting library that utilizes WebGL rendering and GPU acceleration to deliver exceptional performance for a wide range of data visualization needs. It is designed to handle large datasets and complex visualizations with ease, enabling developers to create interactive and visually appealing charts for various applications.
The LightningChart JS v5.0 release introduces WebGL context sharing, enabling the sharing of WebGL resources (e.g. textures, shaders, and buffers) across multiple WebGL contexts. This enhances the performance of multi-chart displays, minimizes memory consumption, and simplifies resource management. It optimizes the rendering of each chart, regardless of their arrangement or quantity. Developers can now employ HTML <div> elements to define chart layouts and use CSS for precise control over positioning.
To see a full list of what's new in v5.0.0, see our release notes.
For more information, see our LightningChart JS product page.
Highcharts is an industry-leading JavaScript charting library, used by tens of thousands of developers and over 80% of the world's 100 largest companies. Highcharts Core (formerly Highcharts JS) is an SVG-based, multi-platform charting library that has been actively developed since 2009.
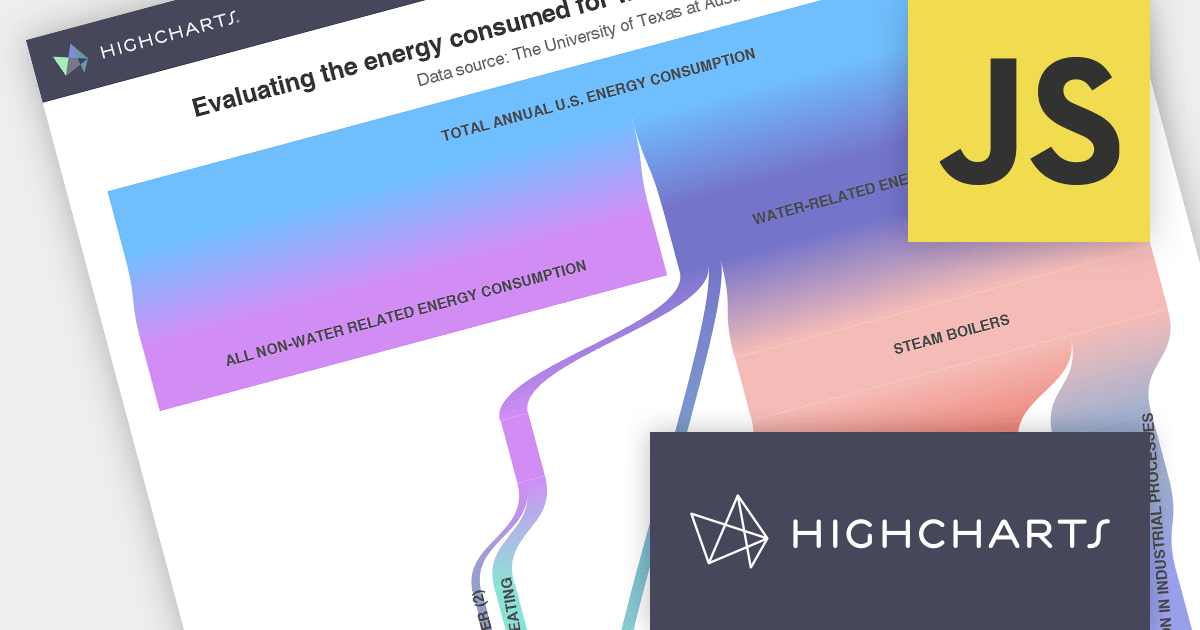
Highcharts v11.2.0 adds new options for the presentation of Sankey chart types. The nodeAlignment option lets you specify which side of the chart nodes should align to, facilitating a vertical layout. The linkColorMode option determines the color mode for Sankey links, including matching the "from" node, the "to" node, or a gradient between the two.
Sankey charts are a type of flow diagram suited to visualizing complex data that changes over time. With the added Sankey chart display options, Highcharts now offers more impactful ways to visualize your data.
To see a full list of what’s new in v11.2.0, see our release notes.
For more information, visit our Highcharts Core product page.
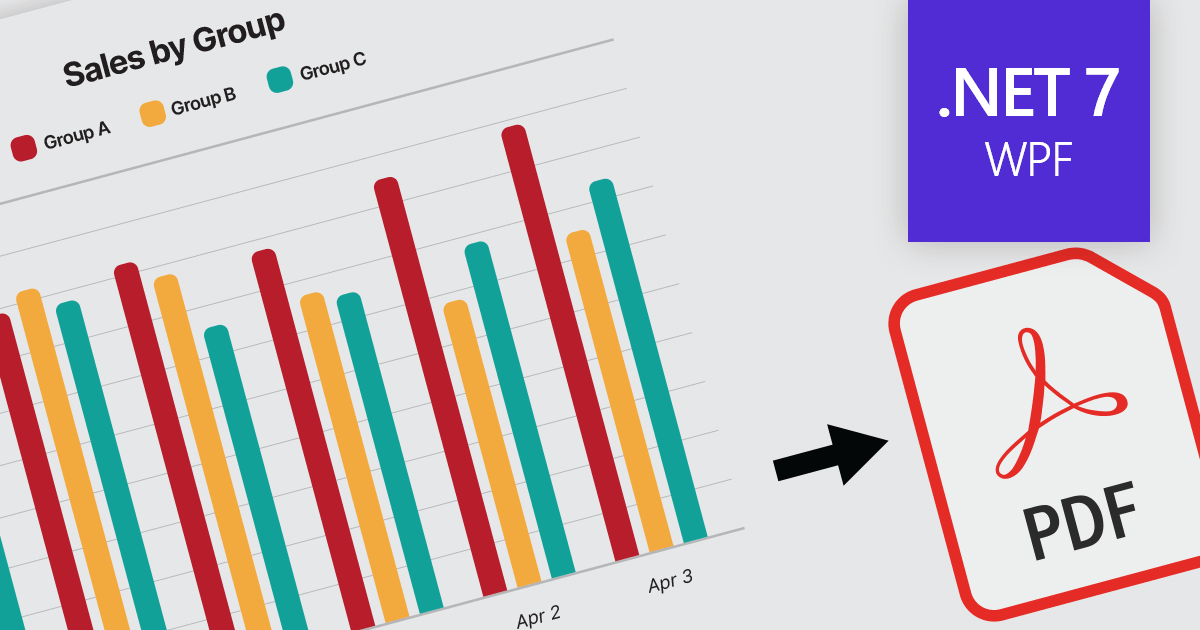
Exporting charts to PDF enables developers to save charts as PDF documents, ensuring their appearance and data are preserved for sharing, printing, or archival purposes. It allows seamless integration of charting capabilities within WPF applications and facilitates the generation of high-quality, portable chart representations in PDF format.
Here is a selection of WPF chart controls that offer PDF export support:
Additionally, the following charting components are available as part of multi-function component suites:
For an in-depth analysis of features and price, visit our comparison of .NET 7 charts.
联系电话: (888) 850 9911
传真: +1 770 250 6199


