













官方供应商
我们作为官方授权经销商,直接提供超过200家开发厂家所发行超过1000个的产品授权给您。
查看我们的所有品牌。

SpreadJS is a JavaScript spreadsheet and data visualization component built to deliver Excel-compatible functionality within web applications. It provides a flexible, high-performance interface for displaying and manipulating tabular data, supporting advanced features such as formulas, pivot tables, charts, conditional formatting, and data binding. SpreadJS integrates smoothly with popular frameworks like React, Angular, and Vue, and includes robust import and export capabilities for Microsoft Excel files. It is commonly used in enterprise applications where users need a responsive, interactive spreadsheet experience directly in the browser.
The SpreadJS 19.0.0 update introduces a new Collaboration Server Add‑on that enables real‑time, multi‑user editing of the same spreadsheet within web applications by integrating the collaboration framework and server infrastructure directly into SpreadJS. This add‑on lets developers build functionality where multiple clients see and apply changes instantly to workbook data with consistent state across users, supports conflict‑free concurrent edits using Operational Transformation logic, and includes features such as live user presence and permission controls.
To see a full list of what's new in 19.0.0, see our release notes.
SpreadJS is licensed per developer and includes 1 Year Maintenance (major and minor version releases and unlimited support phone calls). SpreadJS requires an Annual or Perpetual Deployment License. The optional Add-ons are available at an additional cost, and require a SpreadJS license. See our SpreadJS licensing page for full details.
For more information, visit our SpreadJS product page.
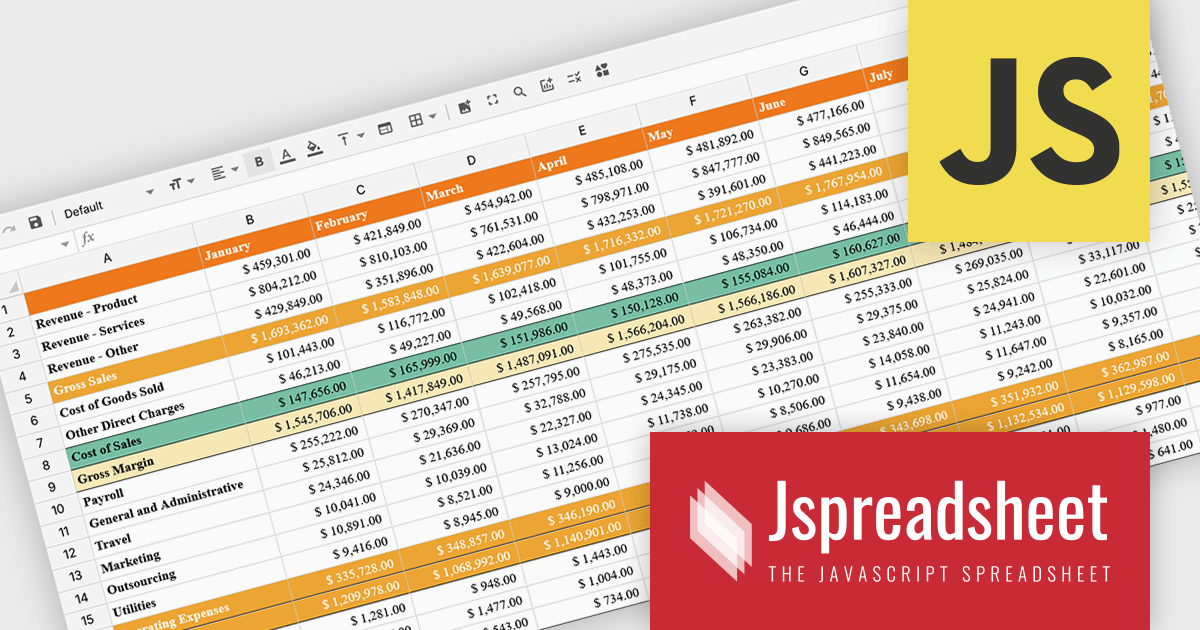
Jspreadsheet Pro is a flexible JavaScript-based spreadsheet solution that enables developers to create customizable, feature-rich data grids for web applications. It offers advanced formulas, data validation, and API integrations. Ideal for tasks like financial modeling, inventory management, and project tracking, it helps businesses efficiently manage and analyze data. Its backend server integration supports real-time data processing, enhancing workflows and boosting productivity across various industries.
The Jspreadsheet Pro v12 update improves handling of large datasets by introducing an extended viewport with optimized rendering that processes only the visible portion of the spreadsheet. This enhancement reduces memory usage, maintains interface responsiveness, and enables smooth interaction even when working with very large or complex data structures. It provides developers with a more scalable foundation for building applications that require high-performance spreadsheet capabilities without compromising speed or usability.
To see a full list of what's new in version 12, see our release notes.
Jspreadsheet Pro is licensed as an Annual or a Perpetual License with support and maintenance. We can supply any Jspreadsheet Pro license including new licenses, maintenance renewals, and upgrade licenses. See our Jspreadsheet Pro for full details.
For more information, visit our Jspreadsheet Pro product page.
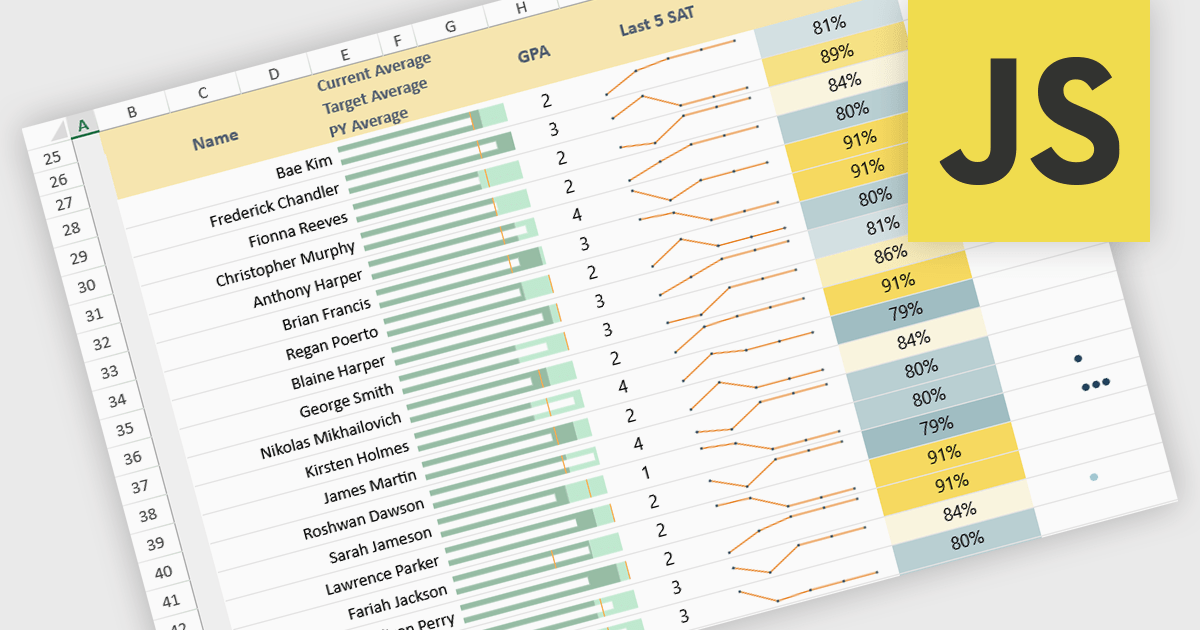
Sparklines in spreadsheets are small, in-cell charts that provide a concise visual summary of data trends without the need for full-sized graphs. They help users quickly identify patterns such as growth, decline, and volatility, making complex information easier to understand at a glance. Because sparklines update automatically with underlying data, they improve real-time analysis and are ideal for dashboards, performance tracking, and financial reporting. Common use cases include monitoring monthly sales performance, comparing product trends side by side, spotting anomalies in operational metrics, and enhancing executive summaries with clear, space-efficient visual context.
Several JavaScript spreadsheet controls offer sparkline functionality:
For an in-depth analysis of features and price, visit our comparison of JavaScript spreadsheet controls.
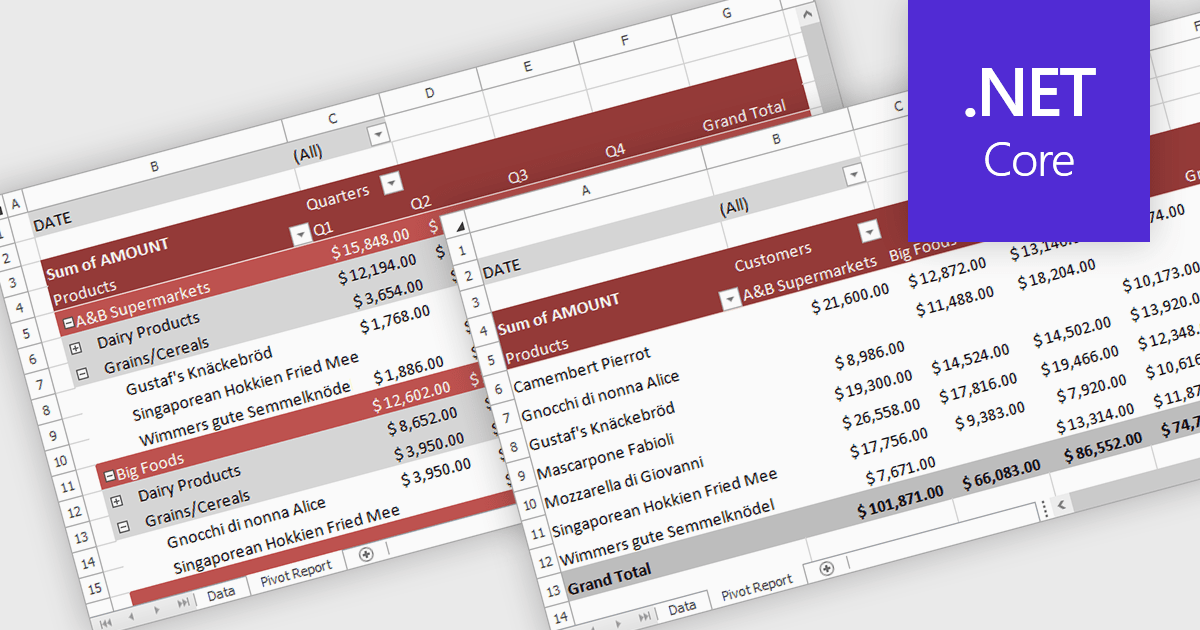
A pivot table in a spreadsheet lets you quickly summarize and explore large datasets by dynamically grouping, filtering, and aggregating data. It automatically calculates totals, averages, counts, and other metrics, reducing the need for complex formulas. This makes it easier to uncover trends, patterns, and outliers, such as comparing sales by region and product, analyzing costs by department, or tracking performance over time. By turning raw data into clear, interactive summaries, pivot tables help users make faster, more informed decisions.
Several .NET Core spreadsheet controls support pivot tables including:
For an in-depth analysis of features and price, visit our .NET Core spreadsheet controls comparison.
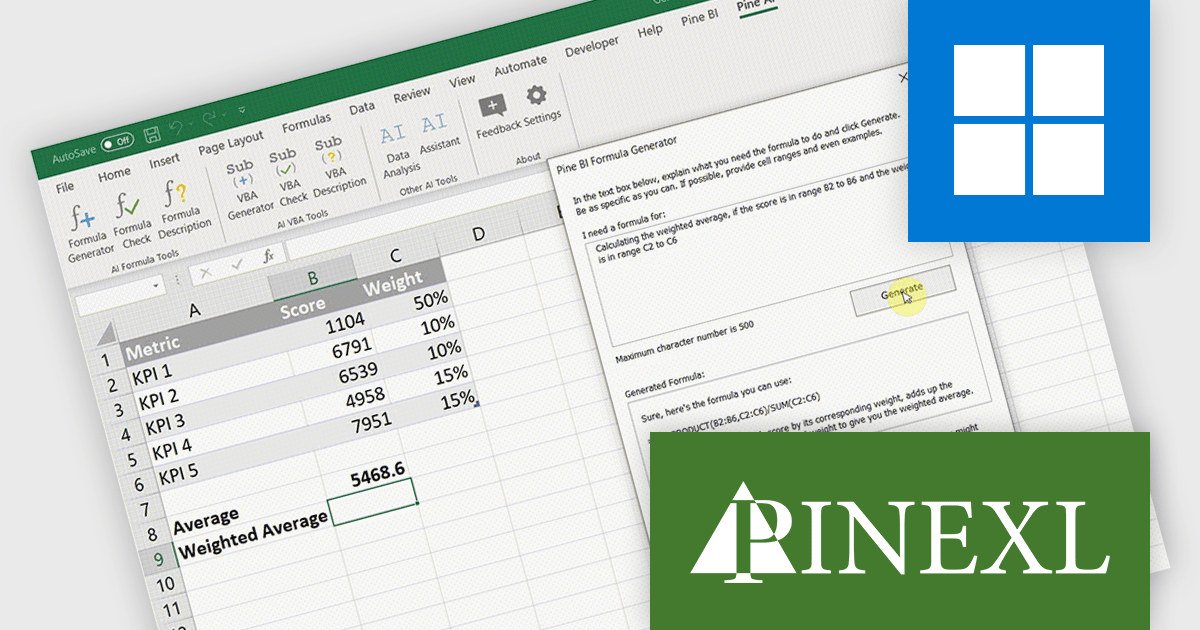
Pine AI Excel Add-In, developed by Pinexl, integrates AI into Microsoft Excel, enabling users to generate, debug, and interpret complex formulas and Visual Basic for Applications (VBA) code by simply describing their requirements. This tool enhances productivity by automating tasks such as data analysis, summarization, transformation, and translation directly within Excel spreadsheets. For instance, users can extract specific information from unstructured data, fill in missing details like country names based on city data, and translate text without leaving the Excel environment.
Pine AI improves formula creation by converting natural language instructions into accurate Excel formulas directly within the workbook, allowing developers to focus on core logic rather than memorizing syntax or troubleshooting complex expressions. It supports multiple languages, minimizes manual errors, and accelerates spreadsheet development, making it easier to incorporate precise calculations into data-driven applications.
Pine AI Excel Add-In is licensed per user on an annual subscription basis. To continue using the software you will need an active subscription. See our Pine AI Excel Add-In licensing page for full details.
Learn more on our Pine AI Excel Add-In product page.
联系电话: (888) 850 9911
传真: +1 770 250 6199


