













官方供应商
我们作为官方授权经销商,直接提供超过200家开发厂家所发行超过1000个的产品授权给您。
查看我们的所有品牌。
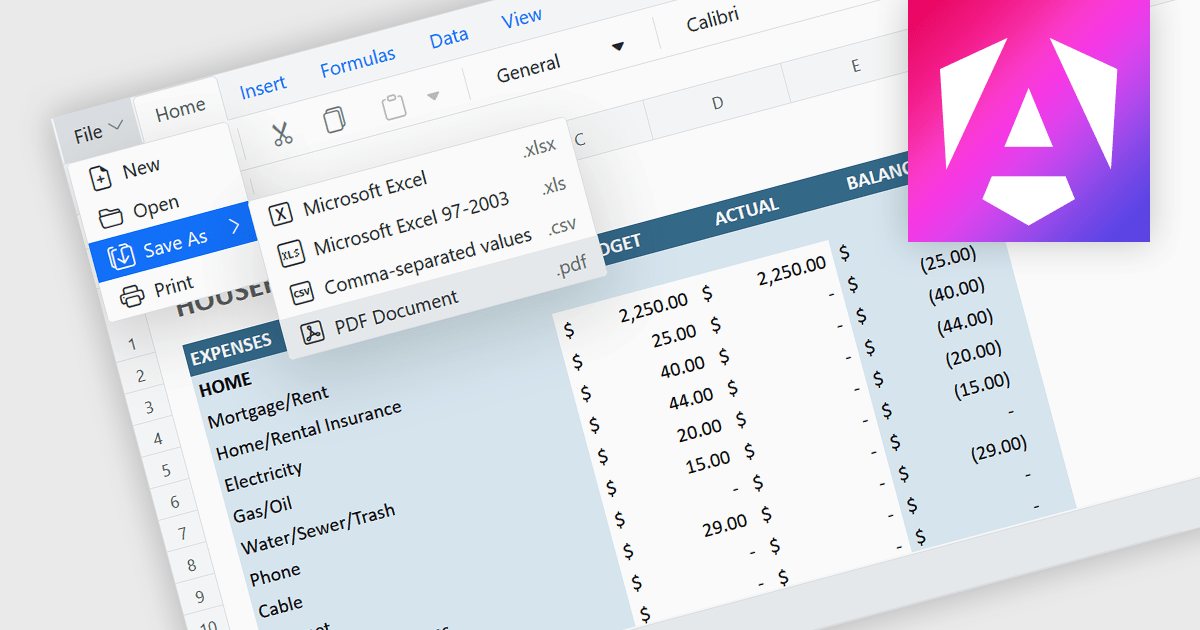
Exporting a spreadsheet to PDF is a widely used feature that allows users to generate fixed-layout, print-ready versions of their spreadsheet data, converting the contents of the spreadsheet file, into a Portable Document Format (PDF) file. This capability ensures that formatting, styling, and content of the original spreadsheet, including tables, charts, and cell styles, are preserved exactly as intended, regardless of the device or application used to open the file. It is especially useful for sharing finalized documents, such as reports or financial summaries, with stakeholders who do not need to interact with the data directly.
Several Angular spreadsheet components allow you to export to PDF, including:
For an in-depth analysis of features and price, visit our comparison of Angular spreadsheet components.
SpreadJS is a complete enterprise JavaScript spreadsheet solution used to create financial reports and dashboards, budgeting and forecasting models, scientific, engineering, healthcare, education, science lab notebooks, and other similar JavaScript business applications. Leverage the high-speed calculation engine with over 500 Excel built-in functions in 19 languages, to deliver true Excel-like spreadsheet experiences with zero dependencies on Excel.
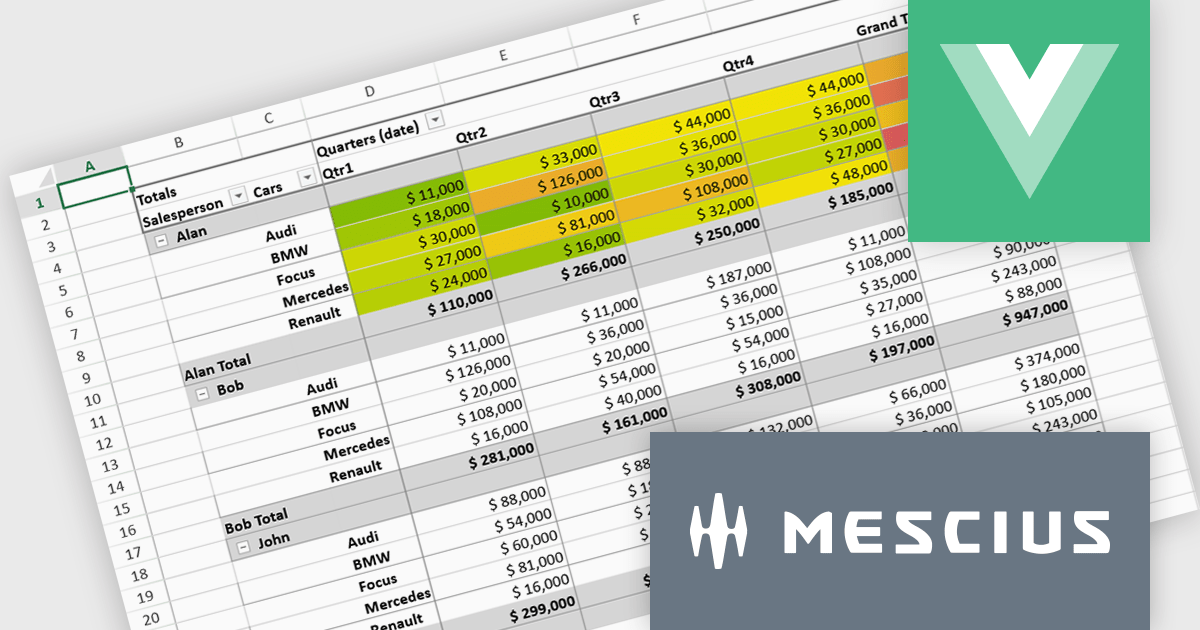
In this blog post, MESCIUS Product Marketing Specialist Mackenzie Albitz shows you the steps for integrating a Pivot Table directly into your Vue application using the SpreadJS Vue Spreadsheet component with its optional Pivot Table add-on. Steps include:
Detailed code is included and you can even download the sample app to get started.
Read the complete blog to get started creating and customizing powerful Vue Spreadsheet Pivot Tables.
SpreadJS is licensed per developer and includes 1 Year Maintenance (major and minor version releases and unlimited support phone calls). SpreadJS requires an Annual or Perpetual Deployment License. The optional Add-ons are available at an additional cost, and require a SpreadJS license. See our SpreadJS licensing page for full details.
For more information, visit our SpreadJS product page.
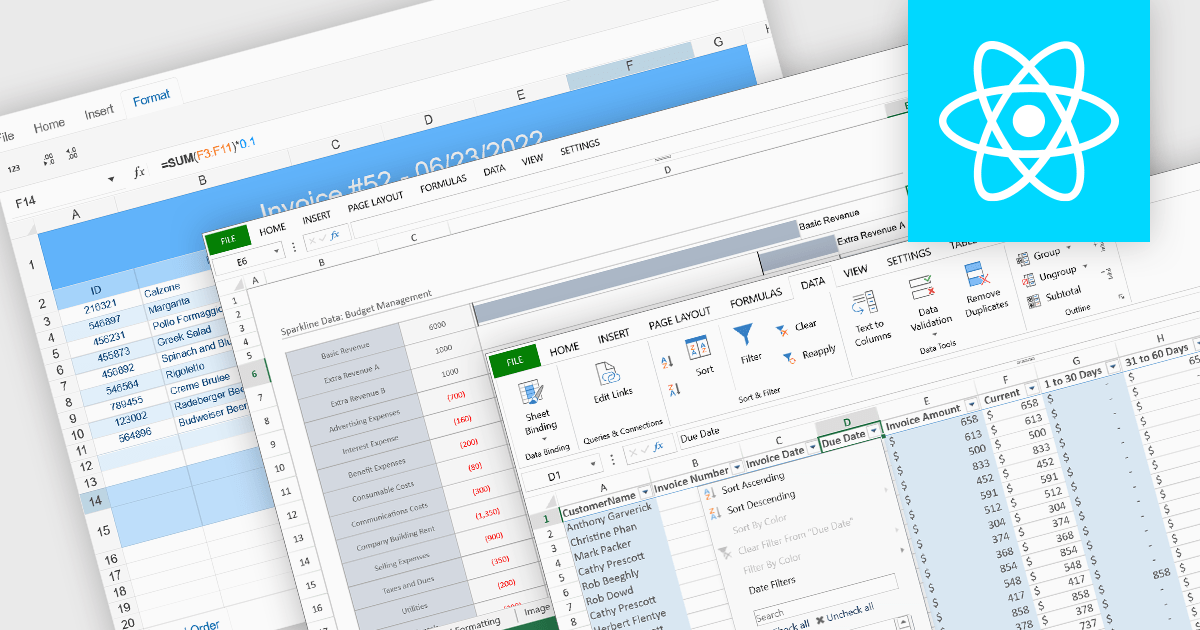
Data organization and analysis features form the backbone of a spreadsheet’s ability to transform raw inputs into meaningful insights. These capabilities go beyond simple data entry, providing the tools necessary to structure, manipulate, and interpret information effectively. By supporting both everyday tasks and complex analytical processes, they enable users to manage datasets of varying scale and complexity while ensuring that information remains accessible and actionable. Well-implemented organization and analysis features allow spreadsheets to serve not only as data storage tools but also as powerful environments for decision-making and reporting.
Common features include:
For an in-depth analysis of features and price, visit our React spreadsheet components comparison.
EPPlus is a powerful and versatile .NET library for managing and manipulating Microsoft Excel files using the Office Open XML (OOXML) format. It is a lightweight and efficient library that is easy to use and can be integrated into a wide range of applications. It allows developers to create, read and modify spreadsheets without dependencies on any other library. Features include pivot tables, styling, VBA/Form controls, conditional formatting, charts, tables, formula calculation, data validation, pictures/shapes, and more.
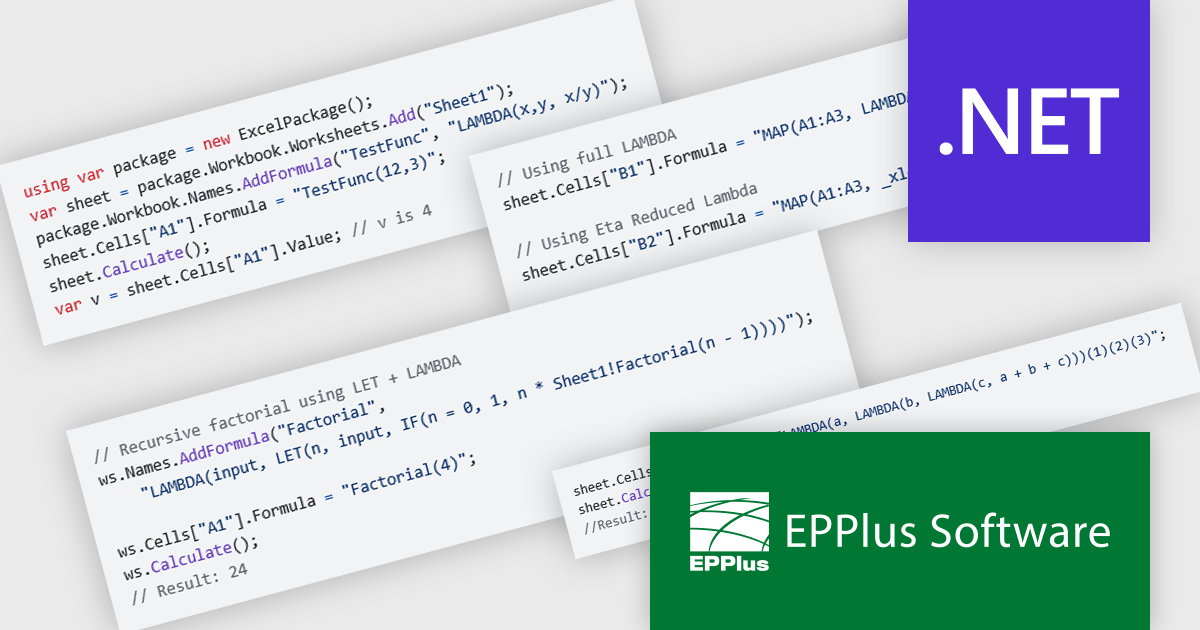
The EPPlus v8.2.0 update introduces support for eight new LAMBDA-based functions, giving developers greater flexibility and control when working with Excel workbook calculations. With these additions, you can now define custom functions directly in the workbook, streamline array transformations, apply operations by row or column, and handle iterative or conditional logic more efficiently. This enhancement reduces the need for repetitive formulas or external code, enabling cleaner, more maintainable spreadsheets that better align with modern programming practices.
To see a full list of what's new in v8.2.0, see our release notes.
EPPlus is licensed per developer and is available as both perpetual licenses and subscription based licenses with periods of 1 year and 2 years, which include support and upgrades. See our EPPlus licensing page for full details.
For more information, see our EPPlus product page.
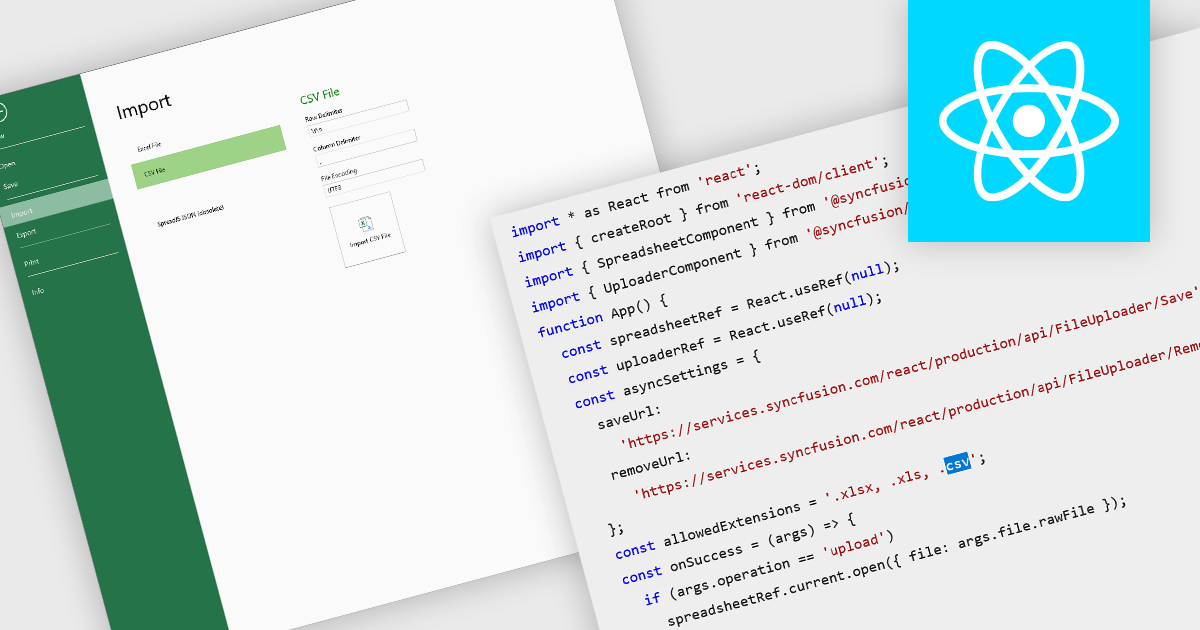
Importing CSV files in spreadsheet components allows developers and end-users to load tabular data from simple text-based formats into an interactive grid. The feature typically supports reading CSV with various delimiters, optional headers, and options about how to treat quoted text, line endings, and text formatting. It provides a bridge between raw data sources (spreadsheets exported from other tools, logs, exports from databases) and richer in-browser or in-application editing, formatting, analysis, or further exporting. For many applications, being able to accept CSV imports is essential for interoperability, ease of data ingestion, and enabling users without deep technical skills to bring their data into a system.
Several React spreadsheet controls offer the ability to import CSV files including:
For an in-depth analysis of features and price, visit our React spreadsheet controls comparison.
联系电话: (888) 850 9911
传真: +1 770 250 6199


