


官方供应商
我们作为官方授权经销商,直接提供超过200家开发厂家所发行超过1000个的产品授权给您。
查看我们的所有品牌。
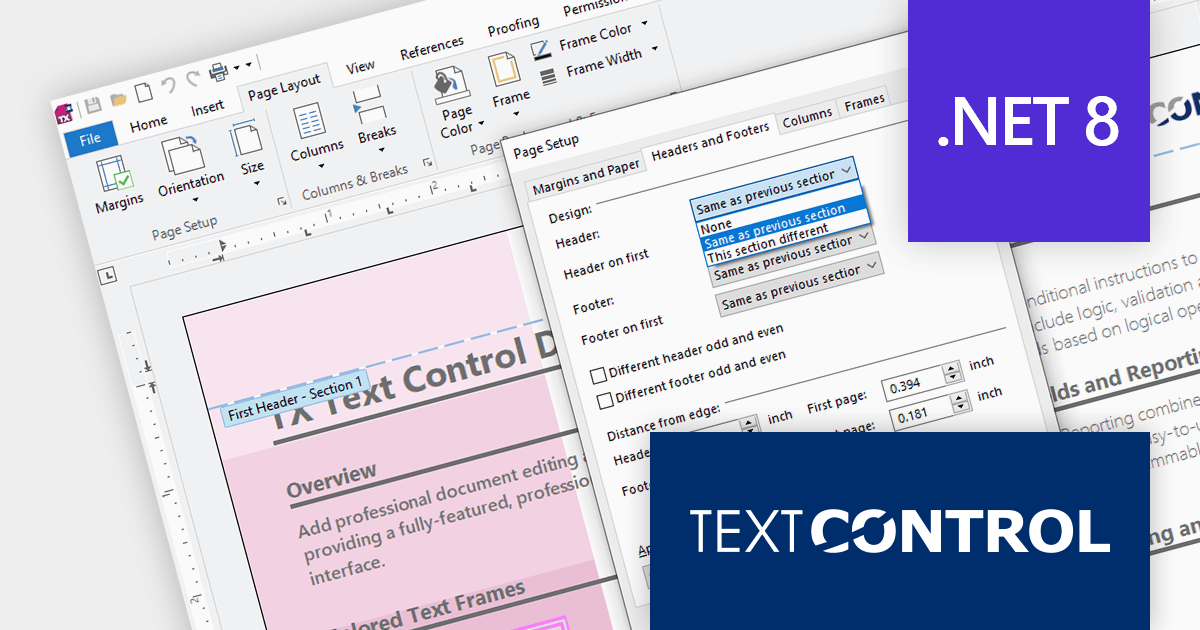
TX Text Control .NET is a royalty-free, fully programmable document editor that empowers developers to add rich WYSIWYG word processing to desktop and web applications across various platforms. It provides everything from comprehensive text formatting and mail merge to PDF creation and processing, all through a robust API and intuitive user interface.
The TX Text Control .NET for Windows Forms and WPF Version 32.0 Service Pack 2 adds support for .NET 8, allowing developers to build word processing applications with the new version of Microsoft's popular framework. Text Control's benchmark tests demonstrate .NET 8's clear advantage over .NET 6 in terms of resource utilization and document processing speed.
To see a full list of what's new in version 32.0 Service Pack 2, see our release notes:
TX Text Control .NET for Windows Forms and TX Text Control .NET for WPF are licensed per developer and are available as a Perpetual License with a 12 month support and maintenance subscription. Subscription renewals are also available. See our TX Text Control .NET for Windows Forms licensing page or TX Text Control .NET for WPF licensing page for full details.
For more information, visit our product pages:

Devart dotConnect is a range of high-performance ADO.NET data providers for various databases and cloud applications, enabling efficient data connectivity for building web and mobile applications. It provides high-performance connectors for databases such as SQL Server and Oracle, as well as Cloud services such as Salesforce and QuickBooks.
The latest releases add support for .NET 8. This allows developers to benefit from the performance improvements, cross-platform compatibility, and new APIs in the latest version of Microsoft's leading development framework.
The dotConnect ADO.NET Data Providers are licensed per developer and are available as a Perpetual License with a 12 month support and maintenance subscription. See our dotConnect licensing pages for BigCommerce, DB2, Dynamics 365, FreshBooks, Magento, Mailchimp, MySQL, Oracle, PostgreSQL, QuickBooks, Salesforce, Salesforce Marketing Cloud, SQL Server, SQLite, SugarCRM, Zoho CRM, and Universal.
For more information about the dotConnect ADO.NET Data Providers visit our product pages:

Devart ODBC Drivers are high-performance connectors that offer easy access to an array of database systems and cloud services. They boast extensive compatibility, advanced functionality like stored procedures and data encryption, and efficient data processing, empowering developers to work with live data across platforms (Windows, macOS, Linux) without relying on additional software or vendor libraries.
Devart has added six new ODBC Drivers to their product range. You can now connect seamlessly to Freshservice, SendGrid, Twilio, Shippo, SurveyMonkey, and QuickBooks Desktop from any application or programming language that supports the ODBC API.
The ODBC Drivers are licensed per developer and are available as an Annual or Perpetual License with a 12 month support and maintenance subscription. See our ODBC Driver licensing pages for Freshservice, SendGrid, Shippo, Twilio, SurveyMonkey, and Quickbooks Desktop.
For more information about the ODBC Drivers visit our product pages:
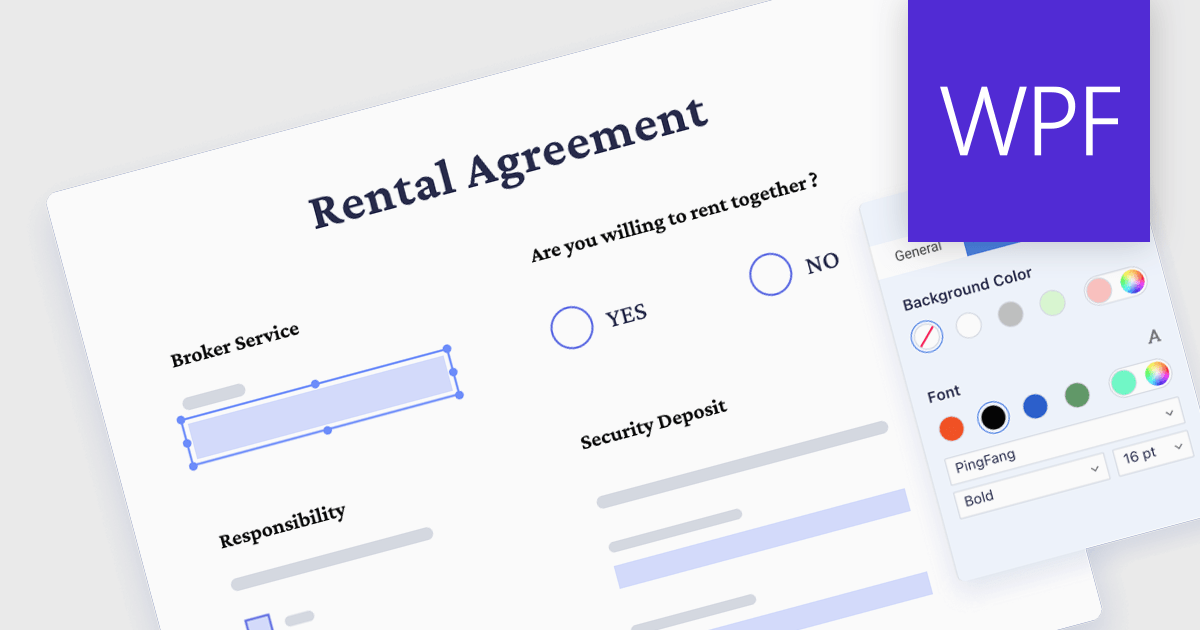
The ability to read, write and fill in form fields in PDFs allows users to directly interact with electronic forms embedded within PDF documents. This includes reading existing text in fields, entering new information, selecting options from checkboxes or dropdown menus, and even digitally signing completed forms. This functionality significantly streamlines workflows by saving time and effort compared to traditional paper forms, reducing printing and signing overhead, and enabling electronic storage and retrieval of filled forms.
Several PDF components for WPF support the reading and writing of form fields, including:
For an in-depth analysis of features and price, visit our WPF PDF Components comparison.
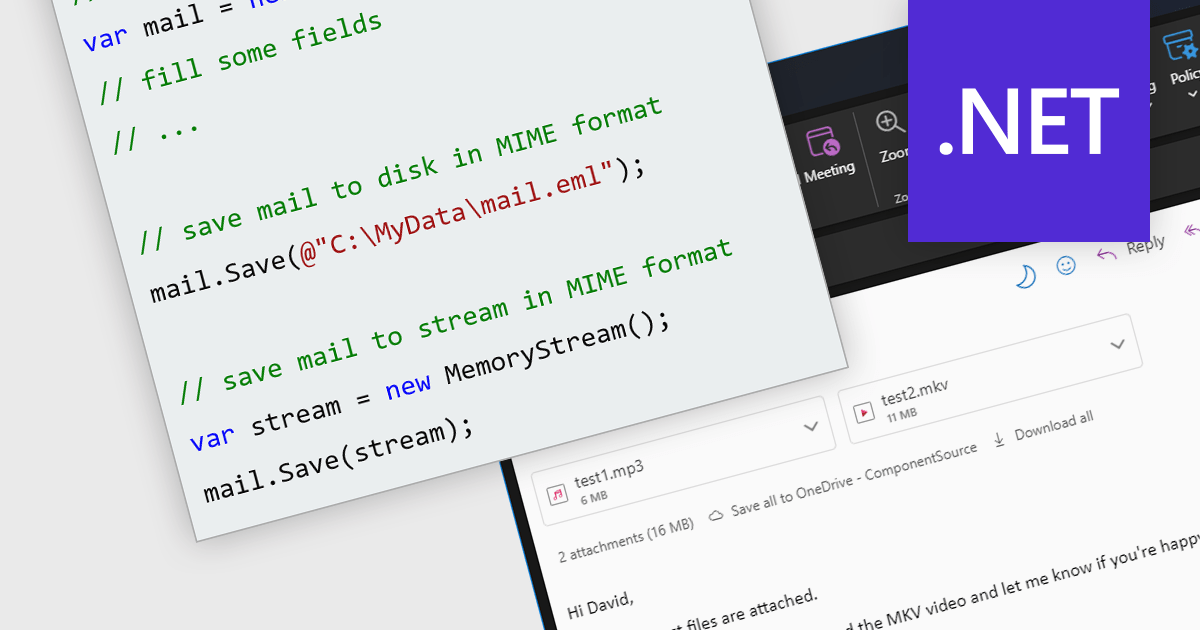
MIME (Multipurpose Internet Mail Extensions) enables the seamless exchange of diverse data beyond plain text. This industry standard acts as a bridge, allowing you to transmit rich content like images, videos and audio via email and other messaging platforms. Furthermore, MIME's multipart structure empowers the inclusion of multiple attachments within a single message, enhancing the efficiency and versatility of communication.
Several .NET comms and messaging components support the MIME format, including:
For an in-depth analysis of features and price, visit our .NET comms and messaging comparison.
联系电话: (888) 850 9911
传真: +1 770 250 6199


