


官方供应商
我们作为官方授权经销商,直接提供超过200家开发厂家所发行超过1000个的产品授权给您。
查看我们的所有品牌。
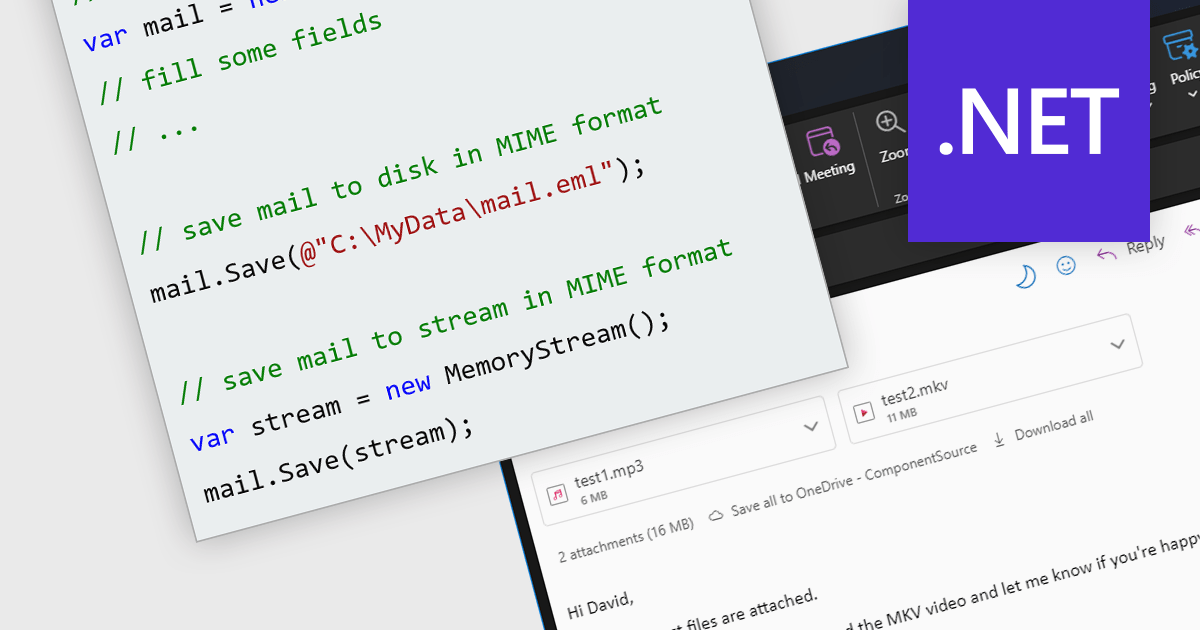
MIME (Multipurpose Internet Mail Extensions) enables the seamless exchange of diverse data beyond plain text. This industry standard acts as a bridge, allowing you to transmit rich content like images, videos and audio via email and other messaging platforms. Furthermore, MIME's multipart structure empowers the inclusion of multiple attachments within a single message, enhancing the efficiency and versatility of communication.
Several .NET comms and messaging components support the MIME format, including:
For an in-depth analysis of features and price, visit our .NET comms and messaging comparison.
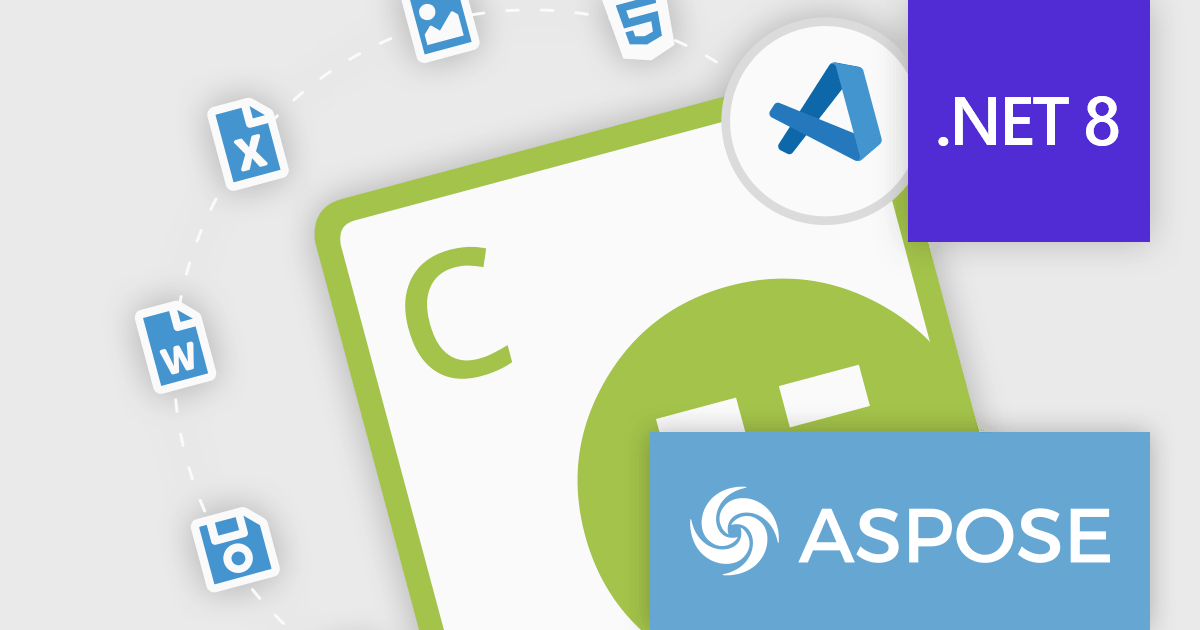
Aspose.Cells for .NET is a robust programming library that empowers developers to manipulate, automate, and convert spreadsheets within their .NET applications. It eliminates dependence on Microsoft Excel while providing comprehensive control over data, formatting, charts, and even conversion to various file formats like PDF, JSON, and image formats, making it a powerful tool for streamlining spreadsheet-related tasks across platforms and environments.
The Aspose.Cells for .NET V24.1 release adds support for .NET 8. This allows developers to enjoy the performance boosts, enhanced cross-platform compatibility, and new APIs in the latest version of Microsoft's popular development framework.
To see a full list of what's new in Aspose.Cells for .NET 24.1, see our release notes.
Aspose.Cells for .NET is offered as Developer Small Business, Developer OEM, Site Small Business, and Site OEM licenses, catering to a range of business needs. Licenses are perpetual, and include 1 year of support and maintenance. Subscription renewals are also available. See our Aspose.Cells for .NET licensing page for full details.
Aspose.Cells for .NET is available to buy in the following products:
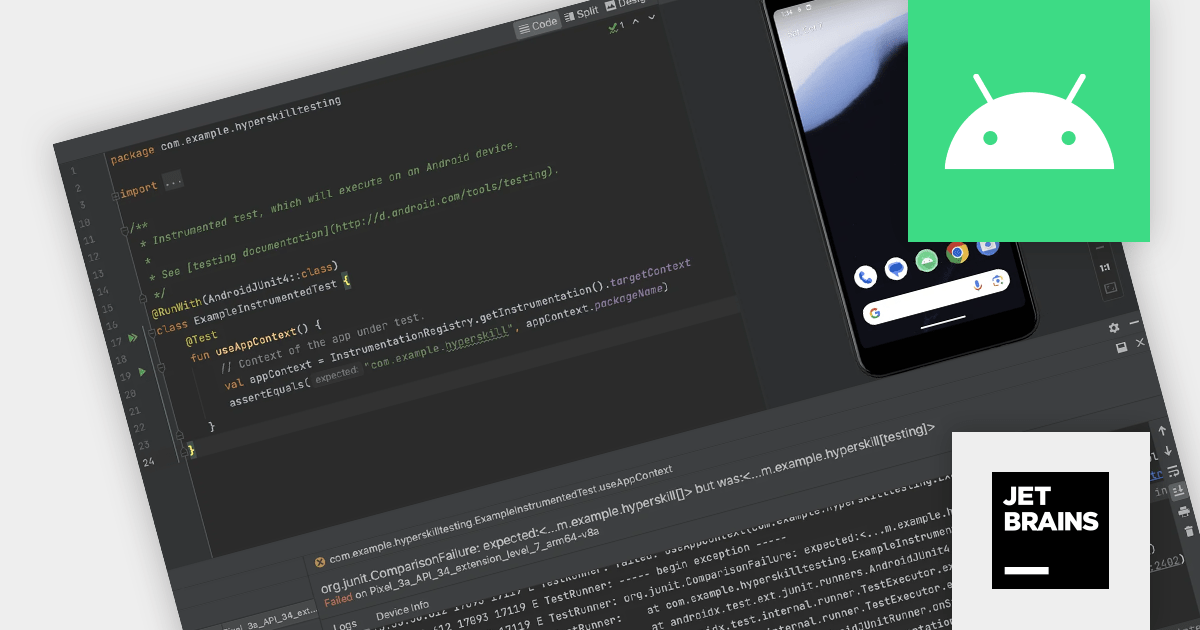
JetBrains Academy is an online educational platform designed to help developers advance their programming skills. It provides a holistic approach to learning in which users study the theory and immediately put it into practice by building working applications. The project-based learning environment is integrated with JetBrains IDEs, and allows developers to learn Java, Python, and other programming languages with ease.
The January 2024 release adds a new Android Studio testing topic. Testing forms the backbone of robust Android app development. By meticulously verifying code and app behavior through Android Studio's built-in tools and frameworks, you can detect and resolve issues before they impact users. This new topic delves into the various ways Android Studio empowers developers to ensure their app's quality and deliver a seamless user experience.
To see a full list of what's new, see our release notes.
JetBrains Academy is licensed per user as a commercial annual subscription. See our JetBrains Academy for Organizations licensing page for full details.
For more information, visit our JetBrains Academy for Organizations product page.

ActiveReportsJS is a reporting tool for web applications that allows developers and report authors to easily design and display reports within their applications. With a wide range of features, such as drill-down, runtime data filtering, and parameter-driven reports, as well as compatibility with popular frameworks, ActiveReportsJS simplifies the process of creating and managing reports.
A Tablix is a versatile report item that acts as a unified platform for displaying data in table, matrix (cross-tab), and list formats. It offers a flexible layout grid with nested rows and columns, allowing you to structure data for easy analysis and visualization. This empowers you to present detailed information, group data by categories, and summarize key metrics, all within a single report element.
In this blog, MESCIUS Technical Engagement Engineer Joel Parks shows you how to use ActiveReportsJS to add a Tablix control to your JavaScript report. Steps include:
Read the full blog and give your users the ability to create flexible reports with the ability to adapt to changing data conditions.
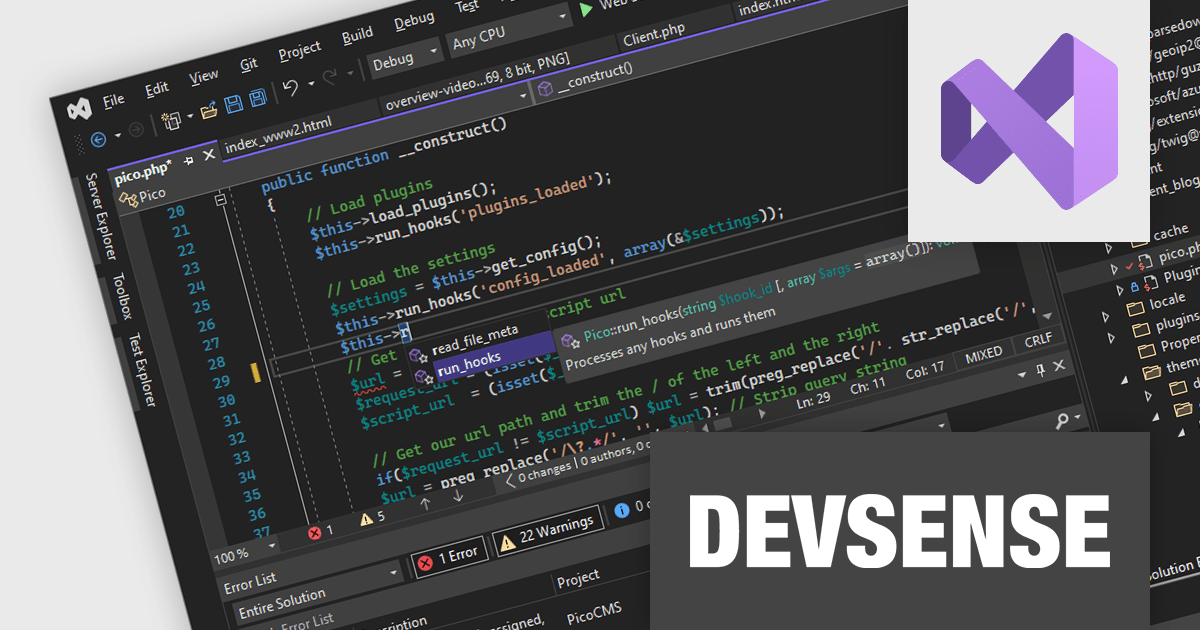
PHP Tools for Visual Studio converts Microsoft's IDE into a complete PHP development environment, increasing productivity with features such as smart code analysis, preemptive code completion, integrated debugging, and project management. This single package combines Visual Studio's familiar interface with industry-standard capabilities, allowing you to easily develop PHP applications and websites.
The PHP Tools for Visual Studio v1.78.19088 release adds support for refactoring private properties. This allows you to seamlessly rename, move, and extract private properties within your PHP project. Refactoring effortlessly transforms your code structure into a tidy and maintainable codebase without breaking anything, all within the familiar Visual Studio environment.
To see a full list of what's new in v1.78.19088, see our release notes.
PHP Tools for Visual Studio is licensed per developer and is available as a perpetual license with 1 year of upgrades and support. See our PHP Tools for Visual Studio licensing page for full details.
For more information, see our PHP Tools for Visual Studio product page.
联系电话: (888) 850 9911
传真: +1 770 250 6199


