


官方供应商
我们作为官方授权经销商,直接提供超过200家开发厂家所发行超过1000个的产品授权给您。
查看我们的所有品牌。
Aspose.Font for .NET is a professional-grade .NET library designed to empower developers with comprehensive font manipulation capabilities. It offers robust functionalities for loading, saving, and converting various font formats, including TrueType, OpenType, and CFF. Its rich API enables detailed analysis of font data structures, including glyph information and encoding schemes. Additionally, Aspose.Font for .NET provides a powerful rendering subsystem for drawing text with accurate font representations.
The 23.12 release of Aspose.Font for .NET and Aspose.Font for C++ adds support for converting SVG fonts to TrueType (TTF) format. This allows developers to readily convert modern, scalable SVG fonts into the widely used TTF format, ensuring compatibility with diverse platforms and applications that don't natively support SVG fonts. The conversion process helps to streamline font integration workflows, removing the need for manual workarounds or reliance on specialized third-party tools.
Aspose.Font for .NET and Aspose.Font for C++ are offered as Developer Small Business, Developer OEM, Site Small Business, and Site OEM licenses, catering to a range of business needs. Licenses are perpetual, and include 1 year of support and maintenance. Subscription renewals are also available. For full details see our Aspose.Font for .NET licensing page.
Aspose.Font for .NET and Aspose.Font for C++ are available to buy in the following products:

DevExpress WinForms is a comprehensive suite of 190+ UI controls and development tools designed for building high-performance desktop applications. It offers a broad array of customizable controls, from data grids and ribbon interfaces to advanced charts, maps, and diagramming components. This empowers developers to rapidly create functionally rich applications, while adhering to accessibility guidelines and touch-enabled technology for modern Windows environments.
The DevExpress WinForms 23.2 release adds accessible keyboard navigation support to several controls, including the Ribbon, Backstage View, Recent Control, Data Grid, TreeList, CardView, Breadcrumb Editor, and Expression Editor. Users can navigate using arrow keys, keyboard shortcuts, and the Enter and Escape keys.
To see a full list of what's new in version 23.2, see our release notes.
DevExpress WinForms is licensed per developer and is available as a Perpetual License with a 12 month support and maintenance subscription. See our DevExpress WinForms licensing page for full details.
DevExpress WinForms is available to buy in the following products:
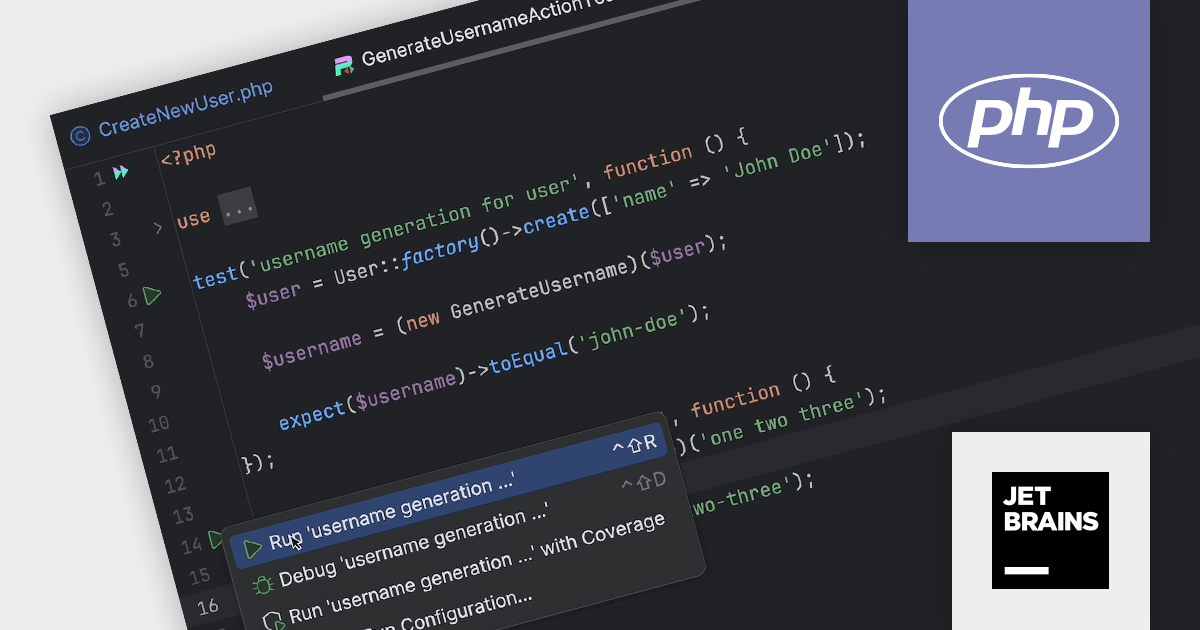
PhpStorm by JetBrains is a sophisticated Integrated Development Environment (IDE) specifically designed for PHP and web development. It offers a range of features to enhance your coding experience, including syntax highlighting, intelligent code completion, on-the-fly error detection, built-in debugging tools, and advanced code refactoring capabilities. Additionally, it supports various web technologies like HTML, CSS, and JavaScript, making it a versatile tool for building complete web applications.
The PhpStorm 2023.3 release now supports the Pest test framework out of the box. Pest is a testing tool for PHP with a focus on simplicity. It uses familiar concepts from PHPUnit but wraps them in a more readable interface. If offers clear error messages, colorful outputs, and features like coverage reports and parallel testing. Using PhpStorm 2023.3 you can now run Pest tests from inside the IDE. When you position your caret within a test and then run it, the IDE will automatically generate a configuration tailored to that particular test.
To see a full list of what's new in version 2023.3, see our release notes.
PhpStorm is licensed per user, and is available as a commercial annual subscription license. We can supply new subscriptions, subscription renewals (including continuity discounts), lapsed renewals, and additional user licenses. See our PhpStorm licensing page for full details.
For more information, visit our PhpStorm product page.
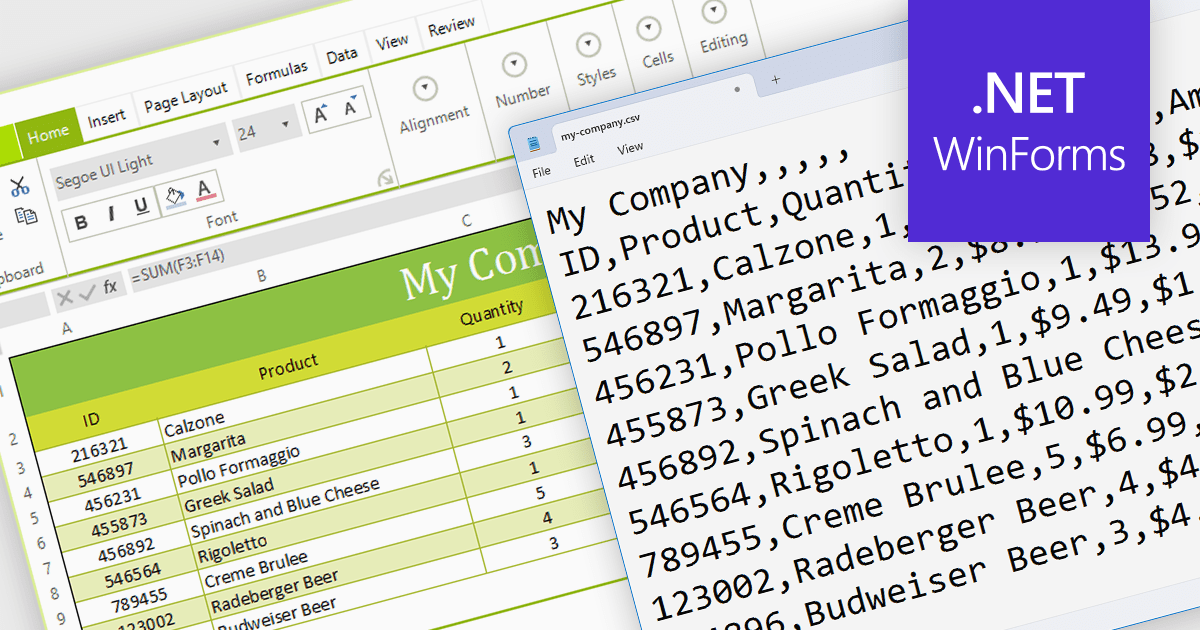
The ability to export to comma-separated values (CSV) from a spreadsheet control enhances interoperability and data accessibility. It seamlessly translates spreadsheet data into the ubiquitous CSV format, fostering effortless integration with a vast ecosystem of analytical tools, databases, and third-party applications. This democratizes your data, empowering users to leverage existing workflows and external expertise, enriching analysis, and maximizing the reach and impact of your data-driven insights.
Several WinForms spreadsheet components provide CSV export functionality, including:
For an in-depth analysis of features and price, visit our WinForms Spreadsheet Component comparison.
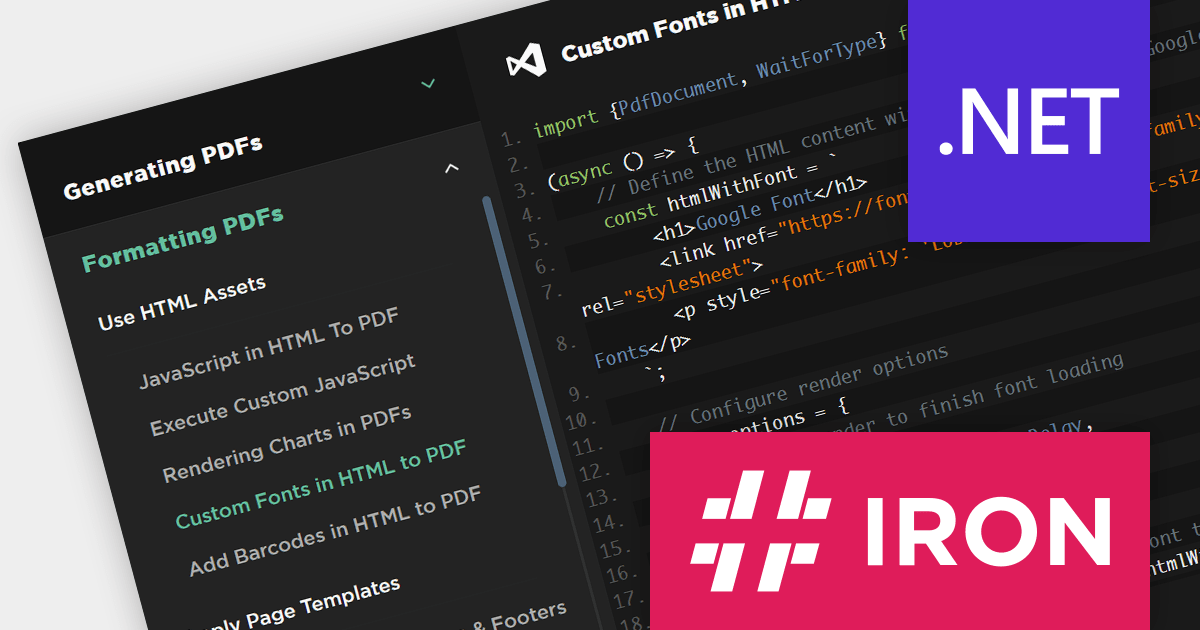
IronPDF for Node.js lets you generate, edit, and extract PDF content in Node.js projects. It is designed for Node.js 12+ and is compatible with various operating systems including Windows, macOS and Linux, and IDEs such as JetBrains WebStorm and Microsoft Visual Studio Code. Its key features include generating PDFs programmatically using Node.js, creating PDFs from HTML, CSS, and JavaScript, adding headers/footers, watermarks or attachments to PDF documents, and securing PDFs using passwords, metadata and digital signatures.
IronPDF for Node.js is licensed per developer and is available as a perpetual license with 1 year of product updates and support services. Lite, Plus and Professional Licenses are available for different development and distribution requirements. See our IronPDF for Node.js licensing page for full details.
IronPDF for Node.js is available to buy in the following products:
联系电话: (888) 850 9911
传真: +1 770 250 6199


