


官方供应商
我们作为官方授权经销商,直接提供超过200家开发厂家所发行超过1000个的产品授权给您。
查看我们的所有品牌。
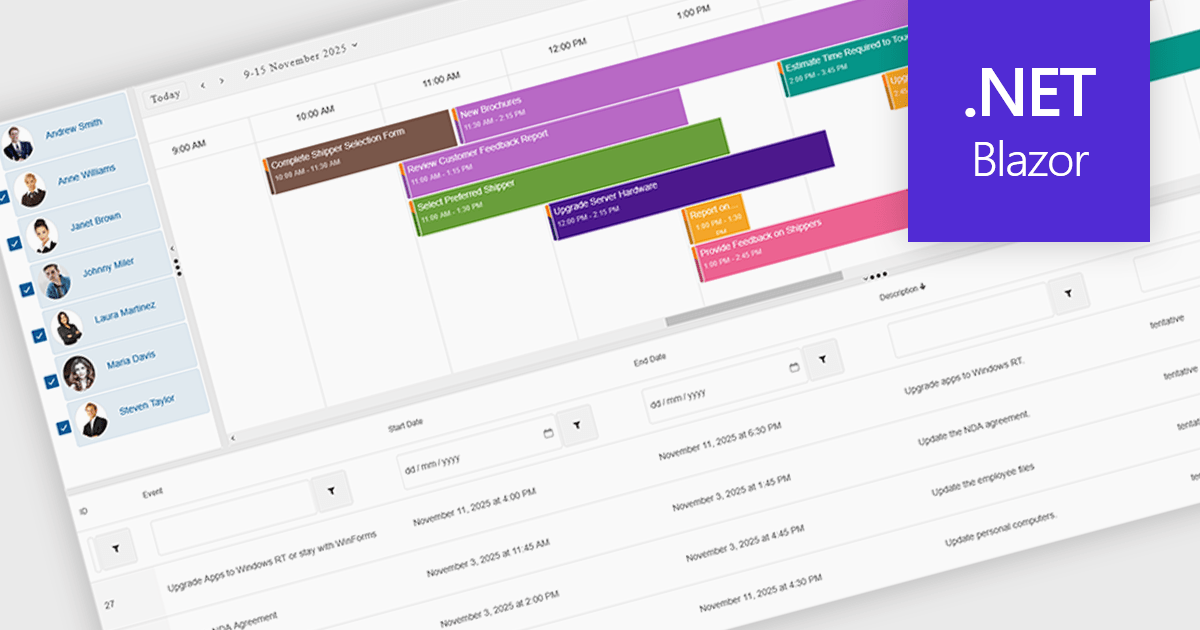
Scheduling components in UI suites provide a visual, interactive way to manage time-based data, with features such as multi-view calendars, drag-and-drop editing, recurrence rules, and group scheduling to simplify planning. They let organizations display daily, weekly, monthly, or timeline views, compare team availability, and tailor the interface to match branding or workflows. Integrated with backend data sources, scheduling components improve clarity, reduce conflicts, and save time across use cases like meeting booking, project management, staff coordination, and customer appointments.
Several .NET Blazor User Interface suites offer scheduling controls including:
For an in-depth analysis of features and price, visit our .NET Blazor UI suites comparison.
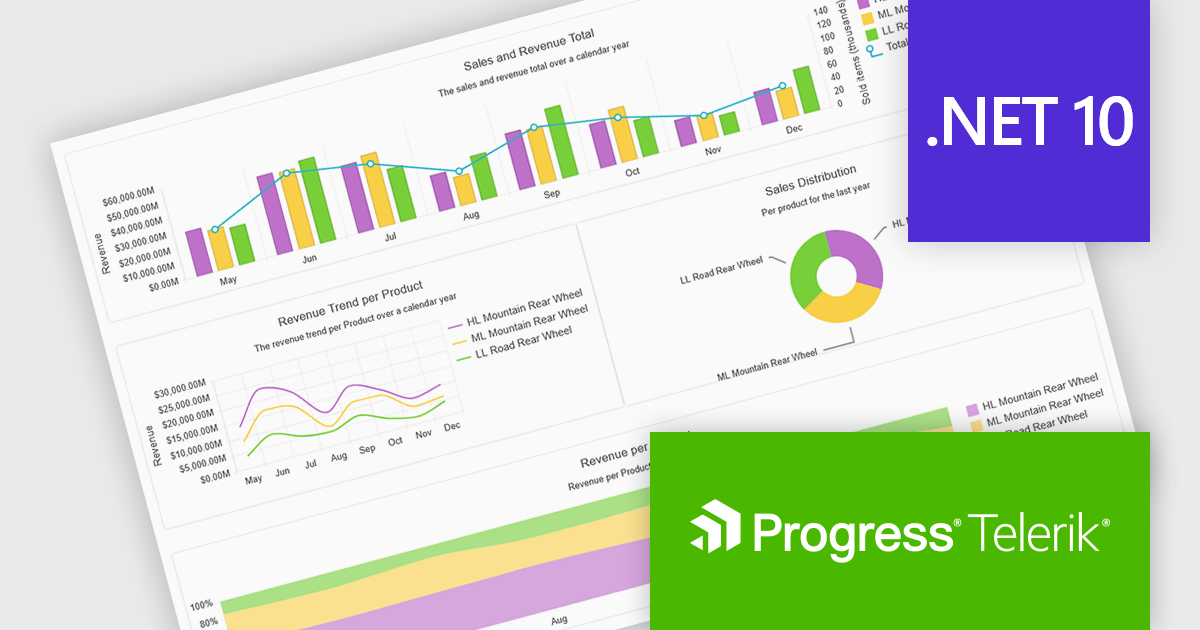
Progress Telerik is a leading provider of UI components, reporting software, and developer productivity tools. Its core Telerik UI product range provides a comprehensive set of libraries for building modern, high-performance and feature-rich applications. These suites are meticulously designed to integrate with .NET and facilitate rapid development across such platforms as ASP.NET Core/MVC/AJAX, Blazor, .NET MAUI, WPF, and WinForms.
Telerik’s .NET 10 support delivers full compatibility with .NET 10 across its .NET UI and developer tooling suites, meaning developers can immediately target the latest runtime and framework improvements. The commitment spans web, desktop and cross-platform stacks, including Blazor, ASP.NET Core, MAUI, WinForms and WPF, enabling teams to upgrade with confidence and leverage performance, security and tooling advancements baked into .NET 10.
Support for .NET 10 is available across the Telerik .NET product range:
Telerik DevCraft is licensed per developer and has two licensing models: an annual Subscription License and a Perpetual License. The Subscription license provides access to the latest product updates, technical support, and exclusive benefits for a flat annual fee, and must be renewed to continue using the software. The Perpetual license is a one-time purchase granting access to the current released version and includes a one-year subscription for product updates and technical support. After this initial period, users can choose to renew the subscription element to continue receiving updates and support; otherwise, they may continue using the installed version available during their active subscription term but will forgo future updates and support. See our Telerik DevCraft Ultimate licensing page for full details.
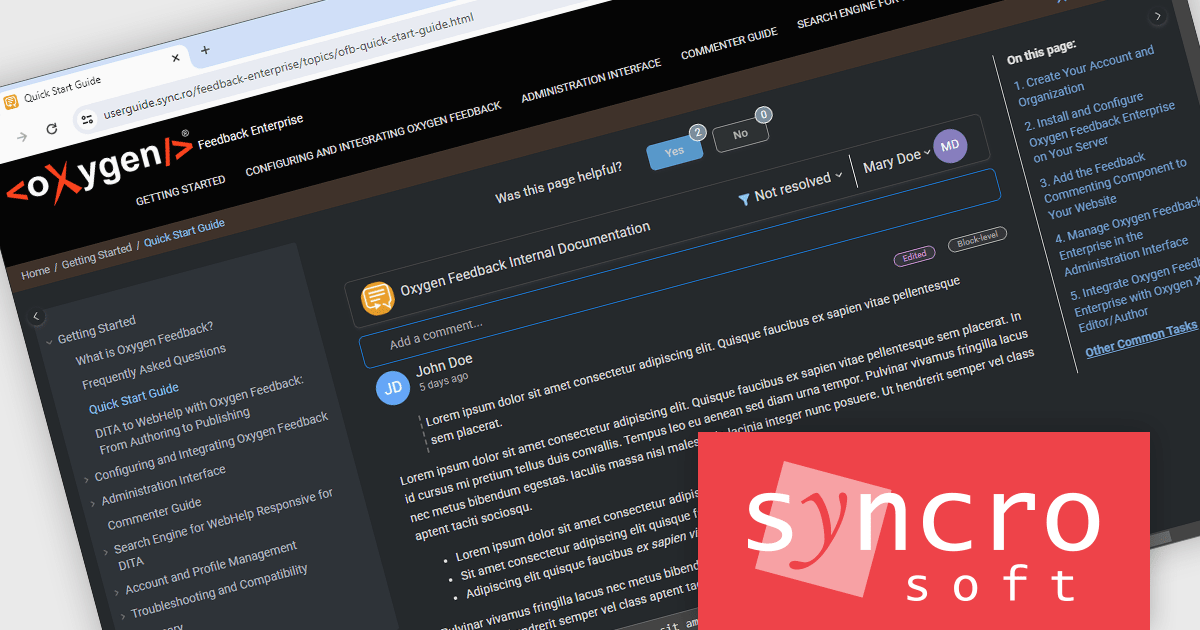
Oxygen Feedback by Syncro Soft is a modern feedback management platform designed for technical writers, software developers, and content managers seeking to streamline user interaction with documentation. It integrates seamlessly with Oxygen XML Editor and WebHelp, enabling teams to gather, manage, and act on user feedback directly within their documentation portals. Key features include intuitive comment tracking, real-time notifications, role-based moderation, and detailed analytics to monitor user engagement and content effectiveness. By simplifying collaboration and enhancing user-driven insights, Oxygen Feedback helps organizations improve documentation quality, increase user satisfaction, and foster stronger connections with their audience.
The Oxygen Feedback Enterprise (AI-ready) V5.3 release adds support for dark themes, allowing the interface to switch easily between light and dark modes, matching the host documentation site’s theme and reducing eye strain for late‑night or prolonged use. It also ensures better accessibility and visual consistency across devices, helping teams maintain brand alignment and deliver a more comfortable feedback workflow in low‑light environments.
To see a full list of what's new in V5.3, see our release notes.
Oxygen Feedback Enterprise (AI-ready) is licensed is licensed per site configuration and is available as a Timed Subscription license. Support & Maintenance Pack (SMP) is included for the duration of your subscription. See our Oxygen Feedback Enterprise (AI-ready) licensing page for full details.
Learn more on our Oxygen Feedback Enterprise (AI-ready) product page.
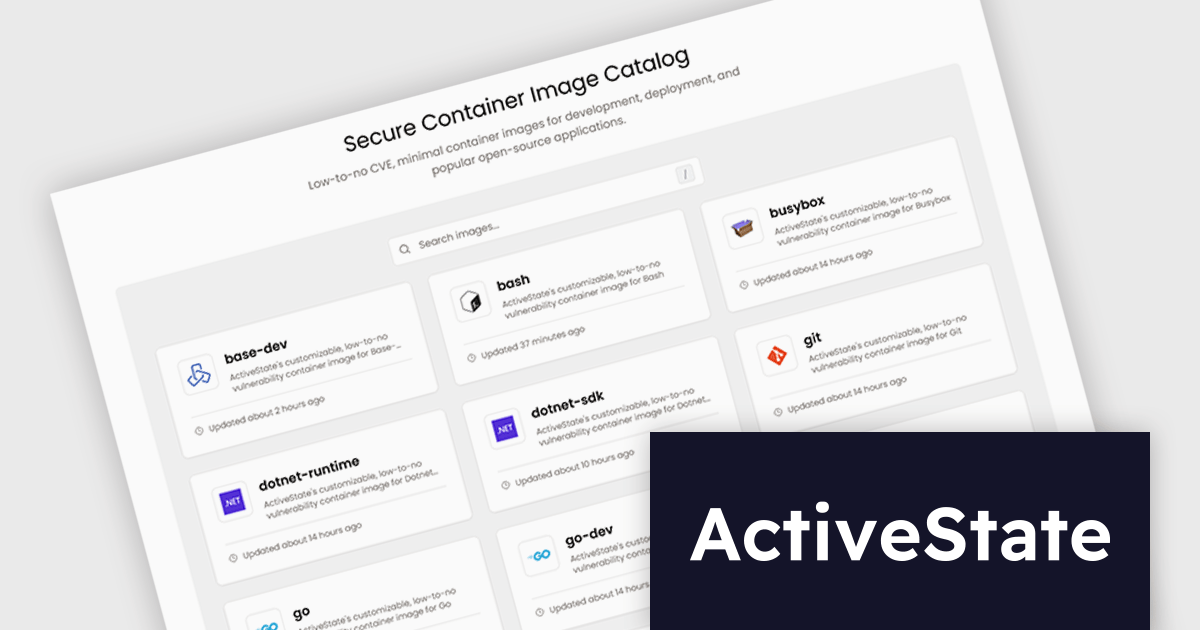
ActiveState Platform is a cloud-based solution that optimizes the secure development, management, and deployment of applications built on Python, Perl, Tcl and Ruby. It offers a curated catalog of open-source packages vetted for security and licensing, along with secure build services that create isolated and verifiable runtime environments. The platform ensures application integrity throughout the development process, from dev environments to CI/CD pipelines, and provides visibility and control over your open source from discovery to deployment. By using ActiveState Platform, you can secure your open source software supply chain in one unified place.
The ActiveState November 2025 update introduces a Public Image Catalog that provides software developers with secure, minimal, and fully transparent container images to improve application delivery. By offering low-to-no-CVE (Common Vulnerabilities and Exposures) containers, clear pull instructions, architecture details, documentation links, and comprehensive metadata such as SBOMs and version history, the update simplifies evaluation and integration while reducing security overhead. This enables teams to maintain consistent environments, and adopt trusted container images with greater confidence.
To see a full list of what's new, see our release notes.
ActiveState Platform is licensed per developer as an annual license. See our ActiveState Platform licensing page for full details.
Learn more on our ActiveState Platform product page.
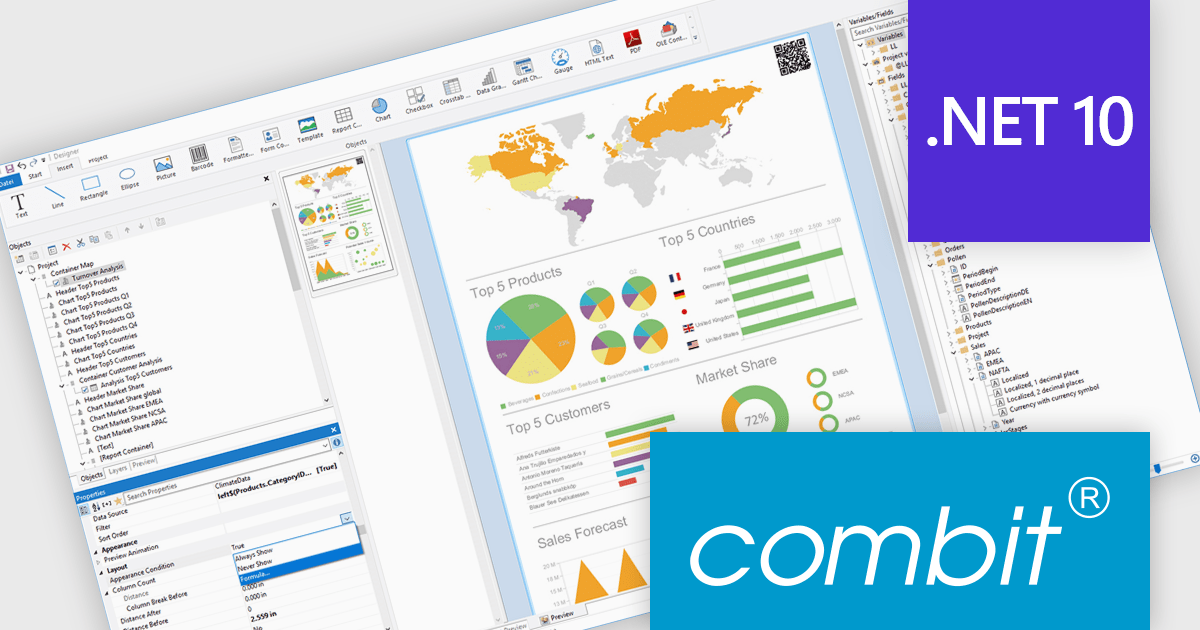
List & Label by combit is a software development toolkit that helps developers to integrate comprehensive reporting functionalities into their desktop, web, and cloud applications. It offers features such as data binding, complex data visualization, and a user-friendly report designer, along with printing, exporting, and previewing capabilities. List & Label operates independently of programming languages and data sources, providing developers with the flexibility to design and deliver informative reports within their development environment.
combit adds .NET 10 support to ensure developers can adopt the newest framework without compatibility concerns, allowing existing reporting logic, data integrations, and application code to run reliably on a modern, secure, and high-performance platform. This update helps teams optimize their upgrade path, maintain a consistent technology stack, and build applications that remain maintainable and future-ready as the .NET ecosystem evolves.
List & Label is licensed per developer and is available as a Perpetual License with a 12 month support and maintenance subscription. See our List & Label licensing page for full details.
List & Label is available in the following products:
联系电话: (888) 850 9911
传真: +1 770 250 6199


