













공식 공급 업체
200 이상의 소프트웨어 개발처와 판매 계약을 맺은 공인 디스트리뷰터로서 합법적인 라이선스를 제공합니다.
모든 브랜드 보기.

JavaScript PDF viewer components provide several features for the seamless and efficient navigation of complex documents, enhancing the user experience in web applications. These viewers allow users to move through PDFs using intuitive controls that support structured document exploration. By leveraging advanced navigation features, developers can integrate smooth, user-friendly access to content, whether through previews in the form of thumbnail images, internal links, or predefined document structures i.e. a table of contents.
Common features include:
For an in-depth analysis of features and price, visit our JavaScript PDF viewer components comparison.
Highsoft is a Norwegian software publisher best known for Highcharts Core, a widely used JavaScript library for interactive data visualization. It specializes in developing powerful, flexible, and accessible charting solutions for developers, businesses, and data analysts. Highcharts is recognized for its seamless integration, extensive customization options, and support for a broad range of chart types, making it a popular choice for web applications and enterprise dashboards. Expanding its data visualization portfolio, Highsoft also offers Highcharts Dashboards, Highcharts Gantt, Highcharts Maps, and Highcharts Stock, catering to diverse analytical and reporting needs.
Highsoft has announced Highcharts Grid Lite, a forthcoming free solution that brings the core functionality of the data grid component in Highcharts Dashboards to a standalone, lightweight package. Designed for seamless integration into modern web applications, it offers high performance while remaining accessible and efficient. It supports WCAG-compliant interactions, ensuring usability across different environments. Its optimized row virtualization enables smooth handling of large datasets without performance degradation. Developers can easily integrate it with frameworks like React, Vue, and Angular while leveraging its intuitive API for streamlined data management and customization. With built-in CSS theming, it allows for flexible styling to match application requirements, making it a reliable solution for creating responsive, interactive tables.
Read the Highcharts Grid Lite blog post for more details on this advanced solution for building responsive, interactive data grids.
To explore the Highsoft product range, including Highcharts Dashboards, visit our Highsoft brand page.
Syncfusion Essential Studio JavaScript is a comprehensive UI library offering over 80 high-performance, lightweight, and responsive components to transform your web apps. Built from scratch with TypeScript, it boasts modularity and touch-friendliness, letting you pick and choose specific features while ensuring smooth mobile interaction. With rich themes, global accessibility features, and extensive documentation, it powers everything from basic buttons to interactive charts and data grids, simplifying frontend development across JavaScript, Angular, React, and Vue.
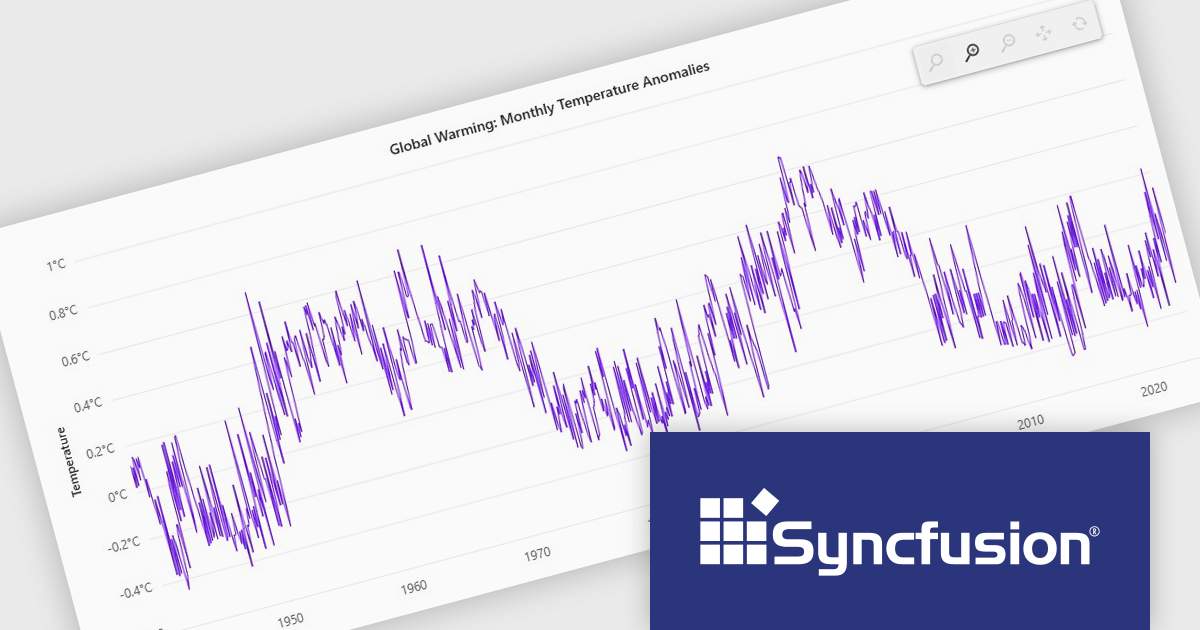
The Syncfusion Essential Studio JavaScript 2024 Volume 4 update introduces a new toolbar feature that allows users to customize the position of the zoom toolbar within charts. With drag-and-drop functionality, this feature offers greater flexibility in interface design, enabling developers to optimize chart layouts for better usability and alignment with specific application requirements. By allowing the toolbar to be re-positioned anywhere within the chart area, this update enhances both user experience and chart readability, providing a more adaptable and professional solution for modern web applications.
To see a full list of what's new in 2024 Volume 4, see our release notes.
Syncfusion Essential Studio JavaScript is available as part of Syncfusion Essential Studio Enterprise which is licensed per developer starting with a Team License of up to five developers. It is available as a 12 Month Timed Subscription License which includes support and maintenance. See our Syncfusion Essential Studio Enterprise licensing page for full details.
Learn more on our Syncfusion Essential Studio JavaScript product page.

Exporting grid data to HTML is a valuable feature in grid components, enabling developers to generate structured, web-friendly representations of their datasets. This capability allows users to capture the current state of a grid, including applied filters, sorting, and formatting, and convert it into a HTML document for sharing, archiving, or further processing. By preserving the layout and styling, exporting to HTML ensures that the visual integrity of the grid is maintained, making it a convenient alternative to exporting data in static formats like CSV or Excel. The ability to export grids as HTML tables allows you to easily integrate the resultant file with web applications, and makes grid applications more useful. This provides flexibility that makes them ideal for a variety of use cases, including reporting, data dashboards, and embedding structured data within web pages.
Several JavaScript grid components allow you to export to HTML, including:
For an in-depth analysis of features and price, visit our comparison of JavaScript grid components.

Data connectivity options allow reporting components to integrate with various data sources to retrieve, process, and display data in reports. It typically involves connecting to databases, APIs, web services, or in-memory data structures to fetch real-time or static data. This connectivity is often achieved through frameworks, libraries, or built-in support for data binding and querying mechanisms, such as RESTful APIs, GraphQL, or direct database connections via server-side proxies. Reliable data connectivity enables reporting components to efficiently manage large datasets, perform transformations, and dynamically refresh reports, delivering interactive and precise insights to end-users.
JavaScript reporting components support various data connections including:
전화 : 00798 14 800 6332
팩스 : +1 770 250 6199


