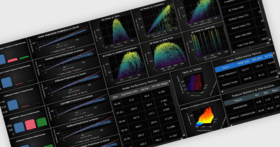
LightningChart Python
Uma biblioteca de visualização de dados 2D e 3D acelerada por GPU de alto desempenho para aplicativos Python de ciência de dados e desenvolvimento de software.
Publicado por LightningChart
Distribuído pela ComponentSource desde 2021
Preços a partir de: $ 882.00 Versão: v2.2 Atualizado: Apr 7, 2026