


官方供应商
我们作为官方授权经销商,直接提供超过200家开发厂家所发行超过1000个的产品授权给您。
查看我们的所有品牌。
Syncfusion Essential Studio JavaScript, available as part of Syncfusion Essential Studio Enterprise, is a comprehensive UI library offering over 80 high-performance, lightweight, and responsive components to transform your web apps. Built from scratch with TypeScript, it boasts modularity and touch-friendliness, letting you pick and choose specific features while ensuring smooth mobile interaction. With rich themes, global accessibility features, and extensive documentation, it powers everything from basic buttons to interactive charts and data grids, simplifying frontend development across JavaScript, Angular, React, and Vue.
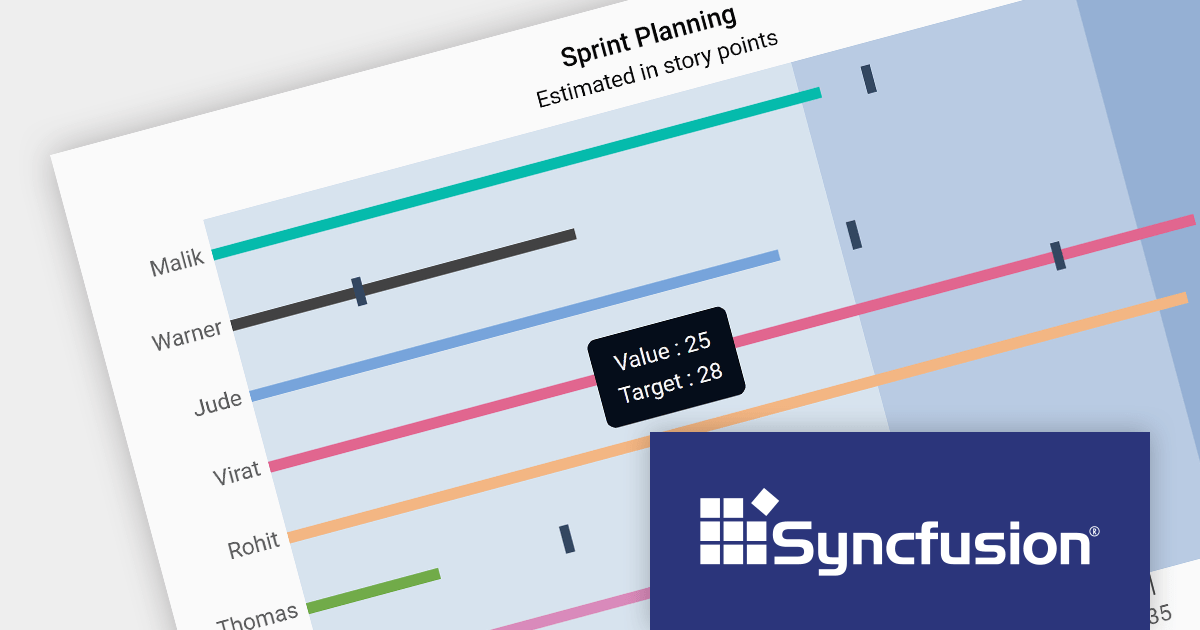
Version 2023 Volume 4 (24.1.41) adds the ability to customize your bullet charts by assigning specific colors to individual value and target bars. Bullet charts are a concise and data-rich visualization tool ideal for dashboards and performance presentations. They efficiently display several key metrics within a single bar, allowing for swift comparison between a primary measure, target values, and qualitative performance ranges. By combining visual cues like color and bar lengths, bullet charts enable rapid interpretation of data, making them perfect for decision-makers who need to grasp complex information at a glance.
To see a full list of what's new in version 2023 Volume 4 (24.1.41), see our release notes.
Syncfusion Essential Studio JavaScript is available as part of Syncfusion Essential Studio Enterprise which is licensed per developer starting with a Team License of up to five developers. It is available as a 12 Month Timed Subscription License which includes support and maintenance. See our Syncfusion Essential Studio Enterprise licensing page for full details.
For more information, visit our Syncfusion Essential Studio JavaScript product page.
DevExtreme Complete is a comprehensive JavaScript UI component suite developed by DevExpress. It provides a wide range of features and tools to help developers build high-performance and responsive web applications for various platforms, including traditional web, mobile, and next-generation web technologies.
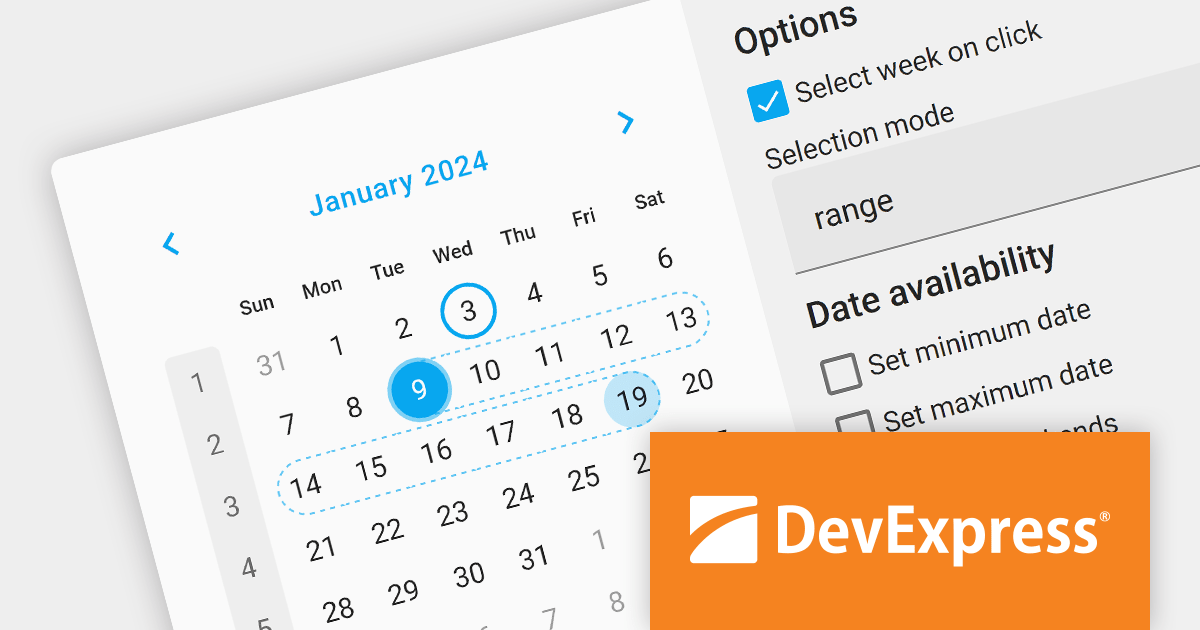
The DevExtreme Complete 23.2 update brings powerful date selection options to the Calendar. You can now select single dates, multiple, or choose a date range with ease. The initial view can be set as a single date or an array, and entire weeks can be selected by clicking on the week number. These powerful new selection enhancements make date selection easier for novices and advanced users alike.
To see a full list of what's new in version 23.2, see our release notes.
DevExtreme Complete is licensed per developer and is available as a Perpetual License with a 12 month support and maintenance subscription. We can supply any DevExtreme Complete license including new subscriptions, subscription renewals, expired subscription renewals, and additional licenses. See our DevExtreme Complete licensing page for full details.
DevExtreme Complete is available to buy in the following products:
SpreadJS by MESCIUS is a powerful JavaScript library that lets you build Excel-like spreadsheets within your web applications. It offers tables, charts, formulas, pivot tables, and more, all running within the browser. It works with major frameworks like Angular, React, and Vue, and offers Excel file import and export. SpreadJS empowers developers to create interactive dashboards, analyze data, and streamline workflows, all within the familiar spreadsheet interface.
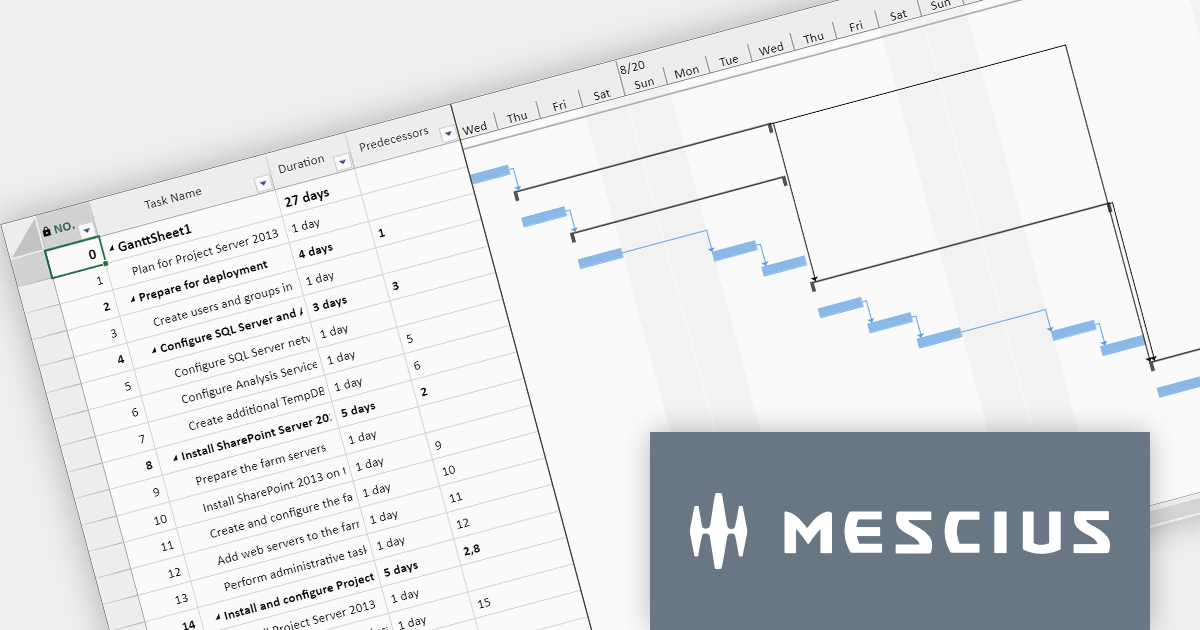
The SpreadJS 17 release introduces the optional GanttSheet Add-On, a full Gantt implementation that works inside of SpreadJS. It seamlessly integrates with your existing spreadsheets, transforming them into clear and concise Gantt charts. This allows you to visualize tasks, dependencies, and progress at a glance, identifying potential bottlenecks and adjust schedules proactively. GanttSheet offers a flexible and intuitive may to manage tasks, sort data, customize calendar settings, and even import/export plans for smooth collaboration.
To see a full list of what's new in version 17, see our release notes.
SpreadJS is licensed per developer and includes 1 Year Maintenance (major and minor version releases and unlimited support phone calls). SpreadJS requires an Annual or Perpetual Deployment License. The GanttSheet Add-On is available at an additional cost, and requires a SpreadJS license. See our SpreadJS licensing page for full details.
For more information, visit our SpreadJS product page.
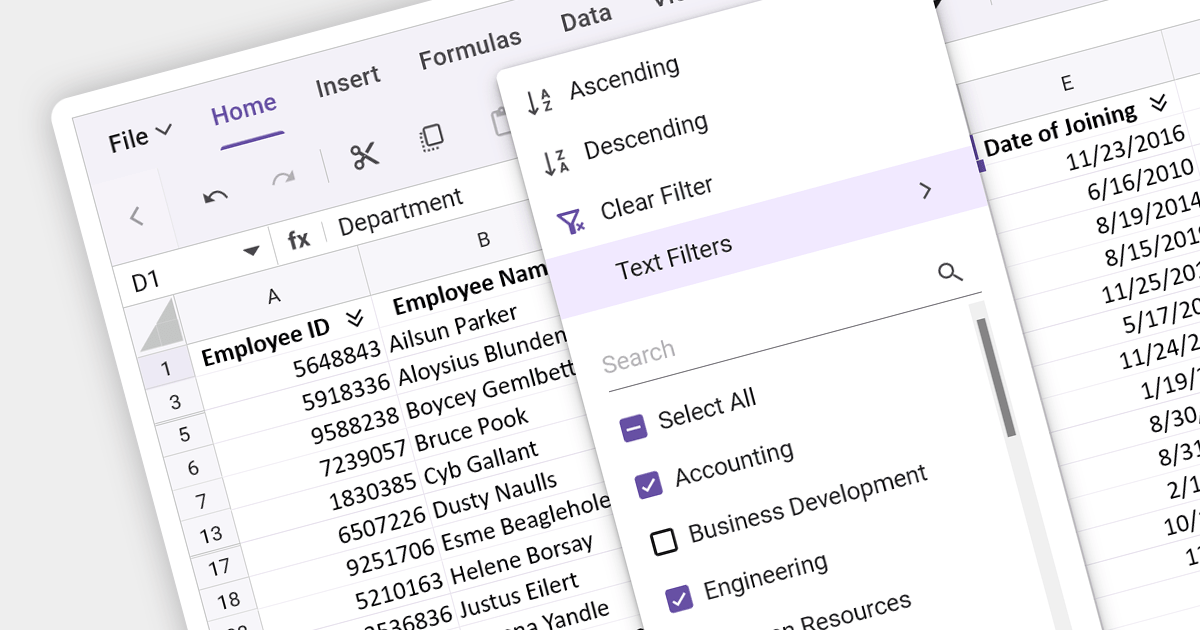
Data filtering and grouping are key spreadsheet features that allow users to manage and analyze large datasets efficiently. Filtering enables users to hide data that does not meet certain criteria, making it easier to focus on relevant information. Grouping clusters related data together, which can then be summarized with functions such as sum, average, and count. These features are vital for working with extensive spreadsheets, enabling users to simplify their view, and gain insights from specific subsets of data.
Several Angular Spreadsheet components provide data filtering and grouping support including:
For an in-depth analysis of features and price, visit our Angular Spreadsheet Component comparison.
Wijmo is a cross-platform UI JavaScript library that offers a comprehensive set of controls and tools for building rich, interactive web applications. Its components have zero dependencies and are written as lean TypeScript classes. Wijmo's key components include FlexGrid for data management, FlexChart for charting and data visualization, Input Controls for user input, and Report Viewer for creating and presenting reports.
The Wijmo 2023 v2 release brings data grouping support to FlexChart. Axis grouping helps to organize complex data by visually separating it into categories or subcategories along the axis, making it easier to identify trends, patterns, and outliers within each group. While data grouping has long been a staple of Wijmo's CollectionView, users requested similar functionality in FlexChart, which MESCIUS has now incorporated. You can bind FlexChart to a grouped CollectionView and set the 'axis.groupsOptions' property to enable grouped labels in your charts.
To see a full list of what's new in version 2023 v2, see our release notes.
Wijmo is licensed per developer. Developer Licenses are perpetual and include 1 year Subscription which provides upgrades, including bug fixes and new features. See our Wijmo licensing page for full details.
For more information, visit our Wijmo product page.
联系电话: (888) 850 9911
传真: +1 770 250 6199


