特性
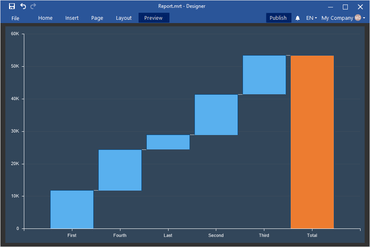
- New Waterfall Chart - A waterfall chart is used to display a running total when you add or remove values.
- Overall Results for Stacked Area Charts - This release adds the ability to display the total for each argument in a Dashbaord Stacked Area chart.
一個易於使用的 JavaScript 報表生成器。

自 2008 的官方分銷商
