


官方供應商
我們作為官方授權經銷商,直接提供超過200家開發廠家所發行超過1000個的產品授權給您。
請參閱我們所有的品牌。
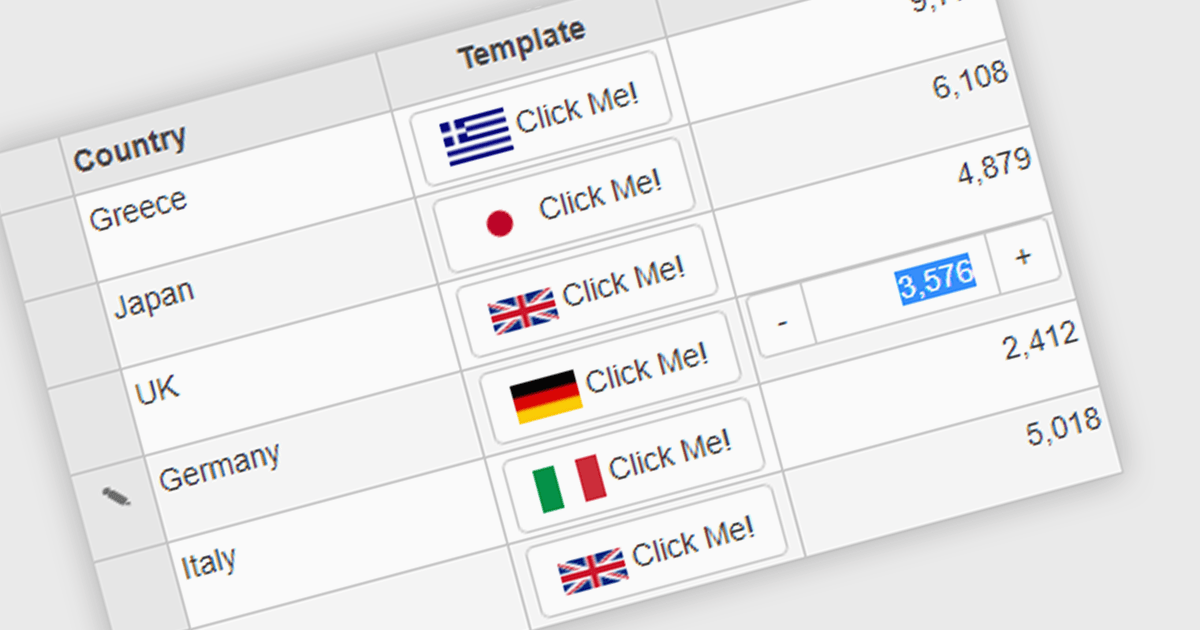
Button cell types allow developers to embed interactive buttons directly within grid cells, enabling users to perform actions such as editing, deleting, viewing details, launching dialogs, or executing custom commands without leaving the grid. By keeping actions closely associated with the relevant data, button cell types reduce unnecessary navigation, and improve usability. This makes them well suited to business applications such as customer relationship management systems, inventory management, financial dashboards, and administrative tools, where users frequently perform row-level actions on large datasets.
Several Angular grid controls offer support for button cell types, including:
For an in-depth analysis of features and price, visit our Angular Grid controls comparison.
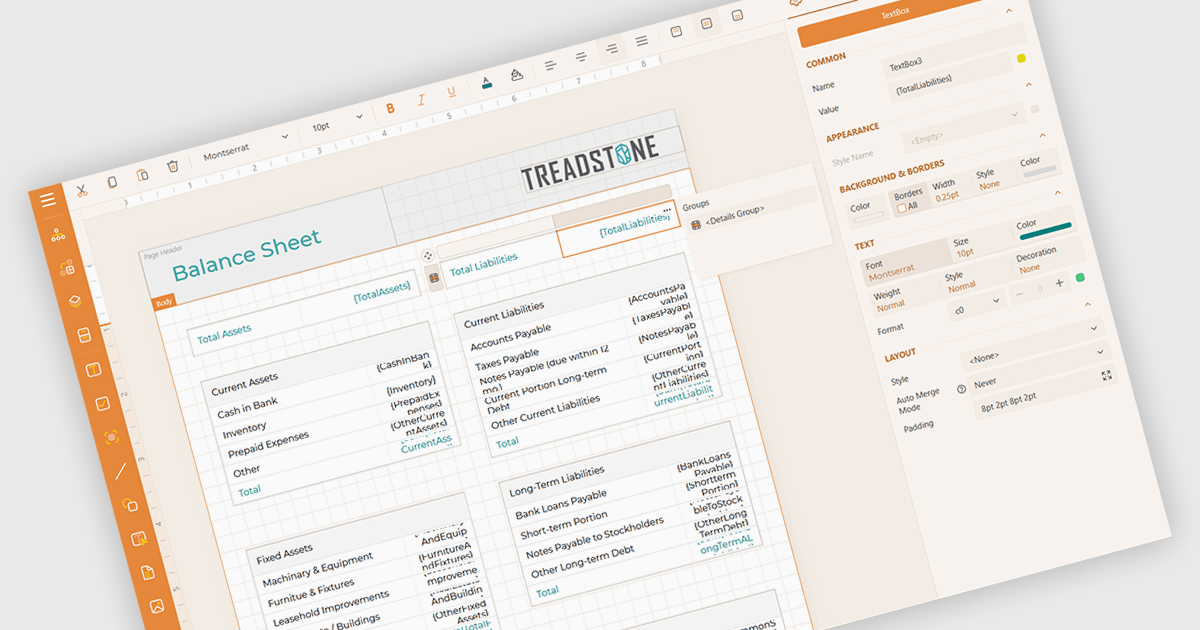
Calculated field support in a reporting component allows developers to define custom values by applying expressions, formulas, or functions to existing data without changing the underlying data source. This makes it possible to derive metrics such as totals, percentages, conditional values, or formatted output directly within a report, reducing the need for additional database queries or application logic. The result is greater flexibility when designing reports, faster adaptation to changing reporting requirements, improved report maintainability, and more consistent business calculations across reports.
Several Angular reporting controls offer support for calculated fields including:
For an in-depth analysis of features and price, visit our comparison of Angular reporting controls.
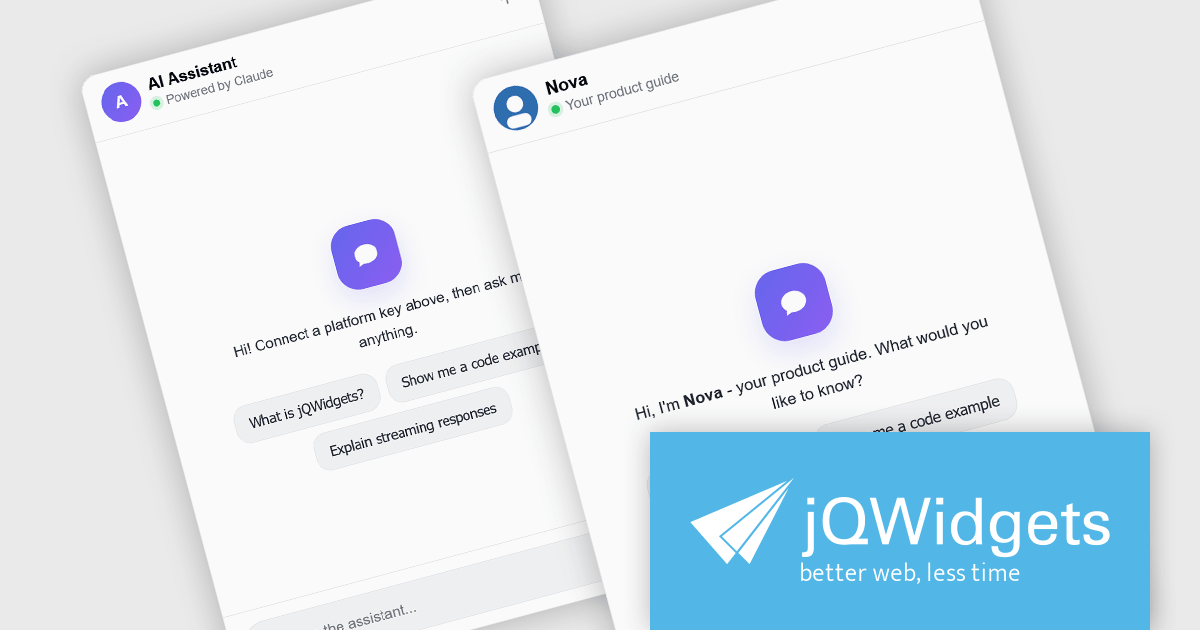
jQWidgets is a comprehensive JavaScript UI framework offering a robust collection of over 60 widgets, themes, and utilities for building professional-grade, cross-platform web applications. Built on jQuery, HTML5, and CSS, it provides extensive functionality including data grids, charts, navigation, input validation, and more. jQWidgets simplifies web development, ensuring your applications work seamlessly across desktop browsers, tablets, and smartphones.
The jQWidgets v26.0.0 release includes a new jqxChat widget which adds conversational capabilities to web applications by providing a ready-to-use interface for real-time messaging and AI-assisted interactions. It supports rich message content, customizable appearance, and flexible integration with backend services and large language model (LLM) providers, making it suitable for customer support, virtual assistants, collaboration tools, and internal business applications. By incorporating jqxChat, developers can add engaging conversational experiences without building a chat interface from scratch, while maintaining the same look, feel, and development approach as the rest of the jQWidgets component library.
To see a full list of what's new in v26.0.0, see our release notes.
jQWidgets is licensed per developer and is available as a Perpetual license 1 year support and maintenance. See our jQWidgets licensing page for full details.
Learn more on our jQWidgets product page.
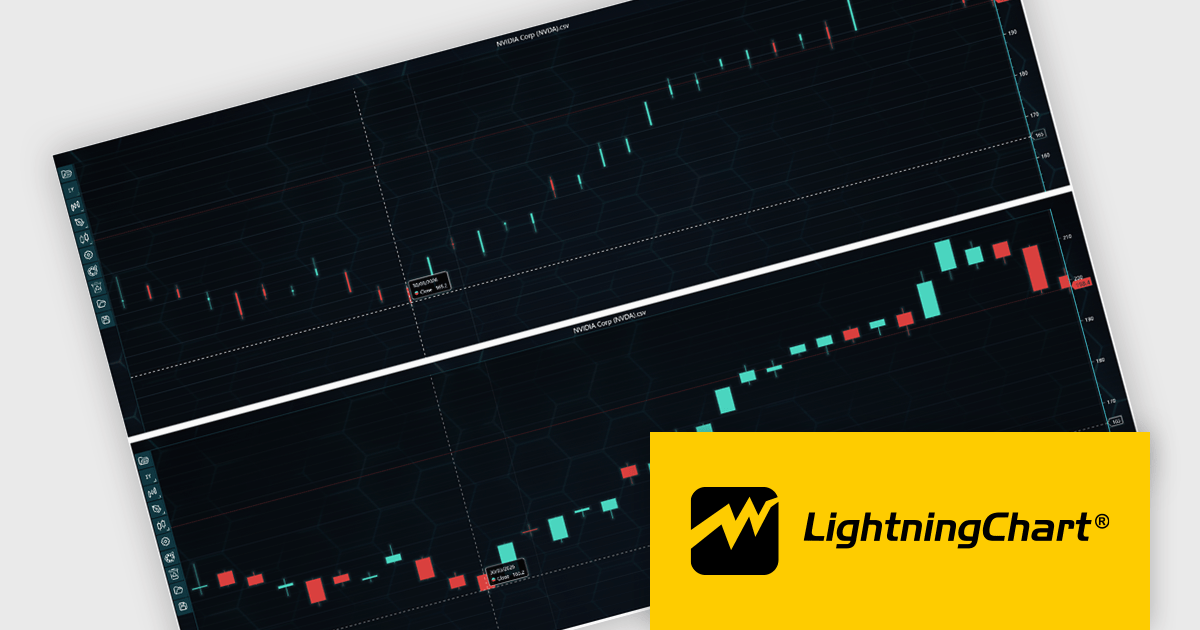
LightningChart JS Trader is a JavaScript/TypeScript library developed by LightningChart that specifically targets the creation of financial and trading applications. It provides high-performance, 2D, 3D, and real-time charting controls and a comprehensive suite of visualizations including candlestick, bar, line, and various technical indicators and drawing tools. This library enables software developers to create interactive technical analysis tools without the need for server-side setup as it runs completely on the client device.
LightningChart JS Trader automatically adjusts the width of candlesticks and bars as users zoom, improving chart readability and making more effective use of available space. By reducing unnecessary gaps between data points, it provides a clearer view of price movements and trends at different zoom levels without requiring manual configuration. This helps developers deliver more intuitive financial charting experiences while retaining the option to disable the feature when fixed-width rendering is preferred.
LightningChart JS Trader is licensed per developer and is available as an annual license with 1 year support. See our LightningChart JS Trader licensing page for full details.
For more information, see our LightningChart JS Trader product page.
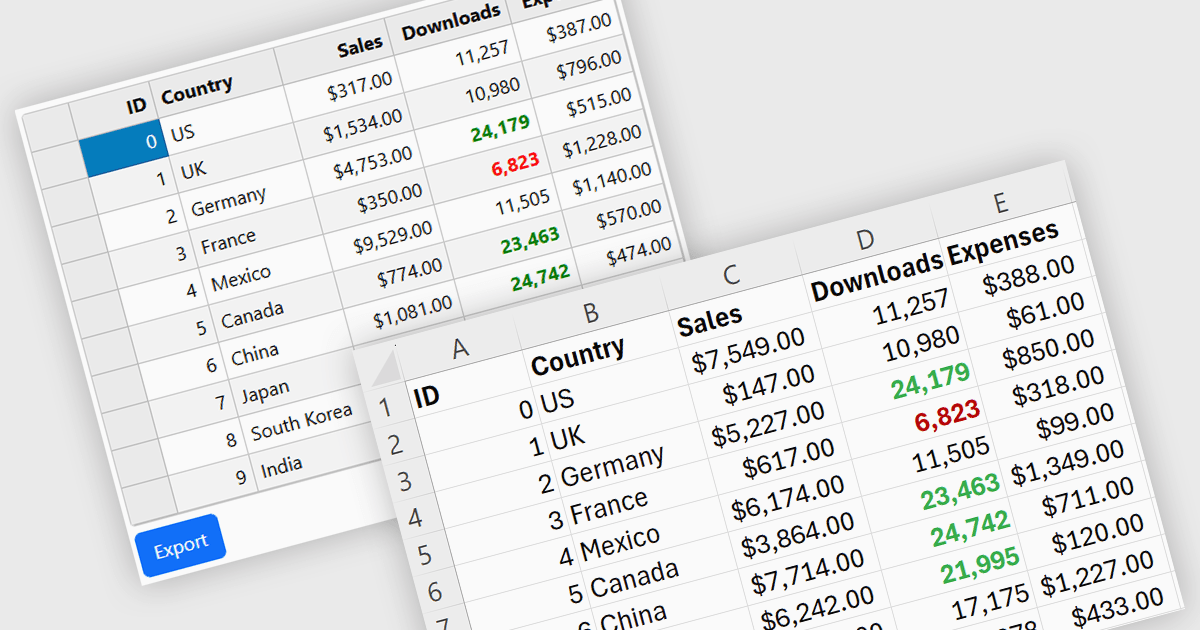
Exporting grid data to XLS/XLSX enables users to save data in Microsoft Excel-compatible formats for editing, analysis, reporting, and sharing. Common use cases include creating business reports, analyzing sales or financial data, sharing information with stakeholders, and preparing datasets for further processing.
Several Angular grid controls offer the ability to export grids to Excel including:
For an in-depth analysis of features and price, visit our Angular grid controls comparison.
聯繫電話: (888) 850 9911
傳真: +1 770 250 6199


