


官方供應商
我們作為官方授權經銷商,直接提供超過200家開發廠家所發行超過1000個的產品授權給您。
請參閱我們所有的品牌。
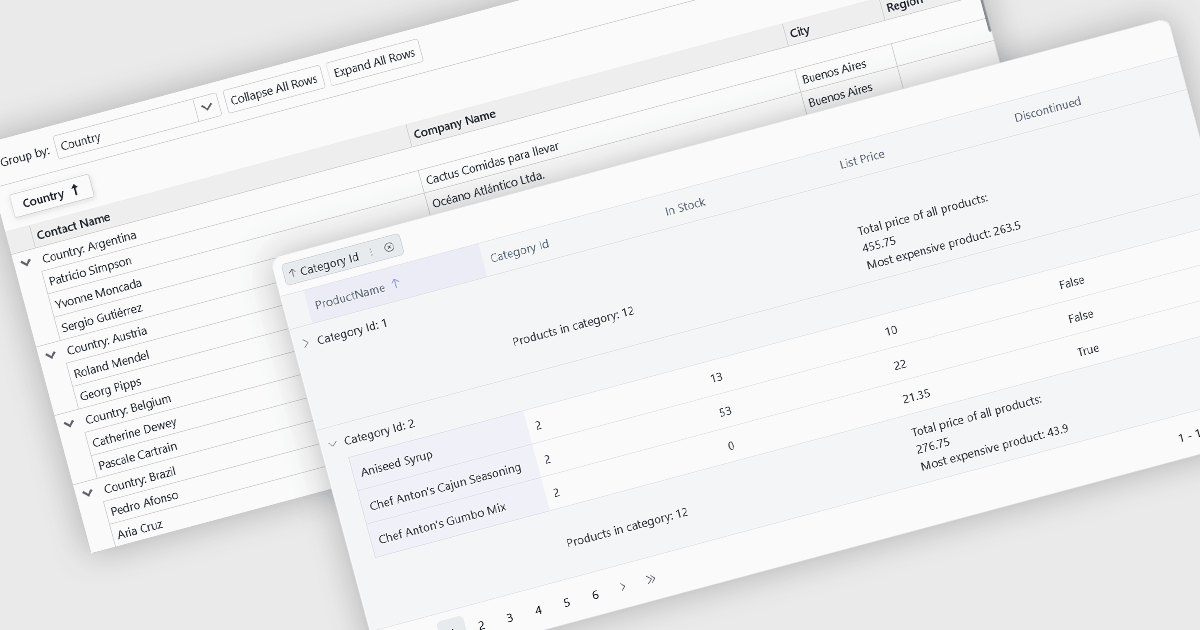
Grouping allows users to organize data by one or more columns, making large datasets easier to navigate and analyze. By collecting related records into expandable groups, it becomes simpler to identify patterns, compare values, and focus on relevant information without manually filtering or sorting the data.
Several Blazor grid controls offer support for grouping including:
For an in-depth analysis of features and price, visit our Blazor grid controls comparison.
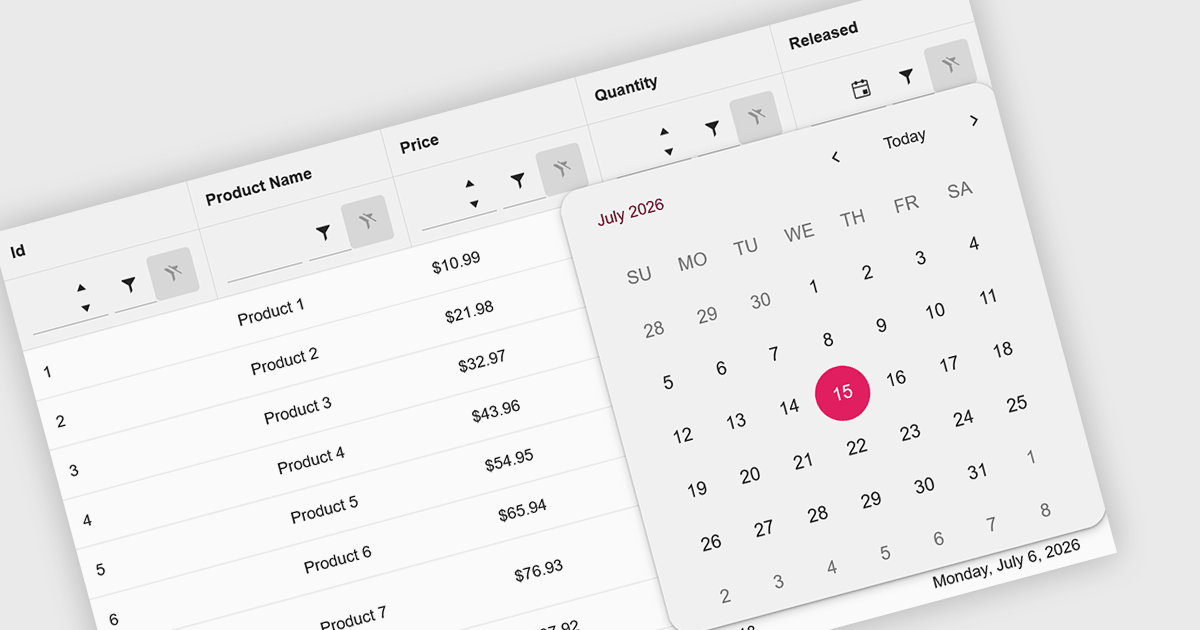
Calendar data entry components provide an integrated date picker that allows users to select dates quickly and accurately instead of entering them manually. This simplifies date input, reduces formatting and typing errors, and creates a more intuitive user experience. By ensuring consistent date values and improving data accuracy, they help developers build more reliable business applications. Common use cases include scheduling appointments, managing project timelines, recording employee leave, booking events, and capturing any information that depends on accurate date selection.
Several .NET Blazor data editor collections offer calendar controls including:
For an in-depth analysis of features and price, visit our comparison of .NET Blazor Data Editors.
Infragistics Ignite UI for Blazor is a comprehensive UI component library designed specifically for .NET developers building modern web applications with Blazor. It offers a rich set of over 60 components, including performant data grids, interactive charts, and essential UI elements. This allows developers to craft visually appealing, feature-packed Blazor applications with a focus on data visualization, user interaction, and a variety of design themes.
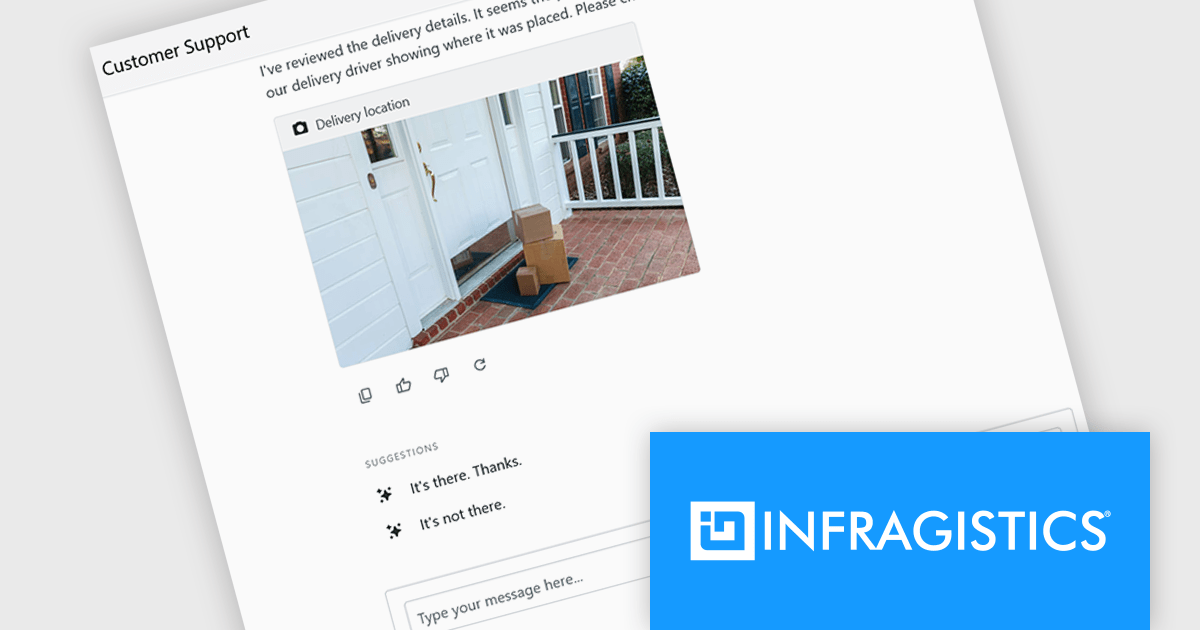
The Ignite UI for Blazor 26.1 release adds a new 'IgbChat' component which introduces a complete chat user interface for Blazor, including message display, user input, reactions, suggestions, typing indicators and support for custom templates. Rather than building each element from scratch, developers can assemble chat experiences using a single component, reducing the amount of UI code required.
To see a full list of what's new in version 26.1, see our release notes.
Infragistics Ignite UI for Blazor is available as part of Infragistics Ignite UI which is licensed per developer and is offered as a Perpetual License with a 1, 2 or 3 year support and maintenance subscription. See our Infragistics Ignite UI licensing page for full details.
Infragistics Ignite UI for Blazor is available in the following products:
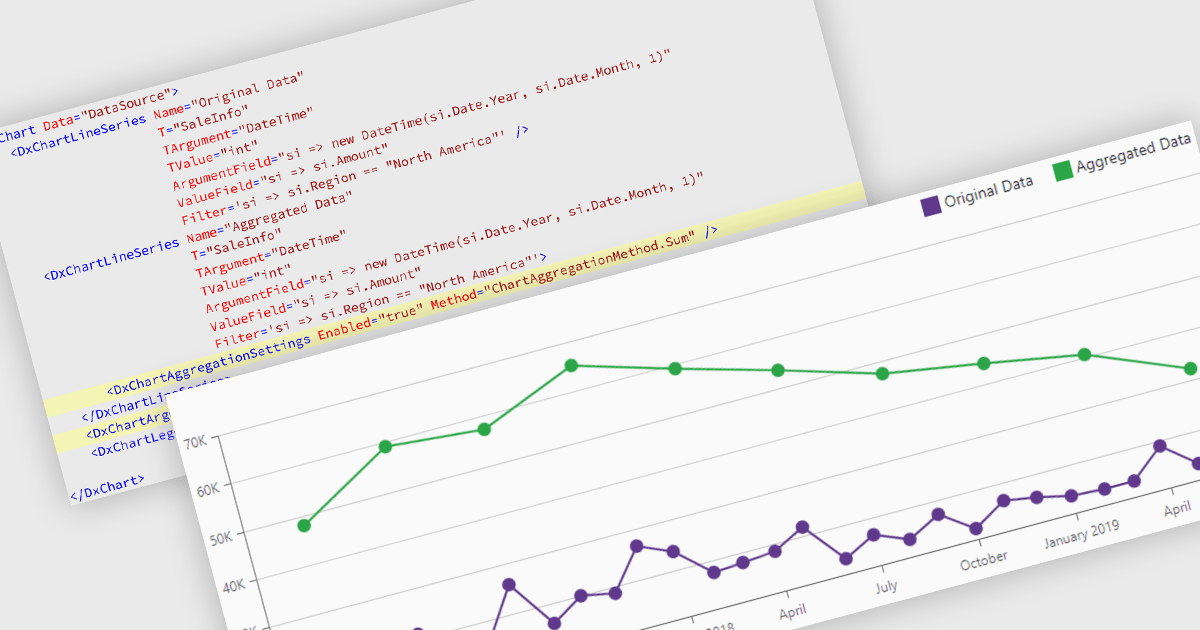
Data aggregation in chart components improves the readability and performance of data visualizations by combining multiple data points into larger, meaningful groups. This enables applications to present large or high-frequency datasets more effectively, reducing visual clutter while preserving overall trends and patterns. Aggregation can be applied dynamically based on the displayed range or selected interval, allowing users to explore data at different levels of detail without compromising responsiveness.
Several Blazor charting controls support data aggregation including:
For an in-depth analysis of features and price, visit our Blazor charting controls comparison.
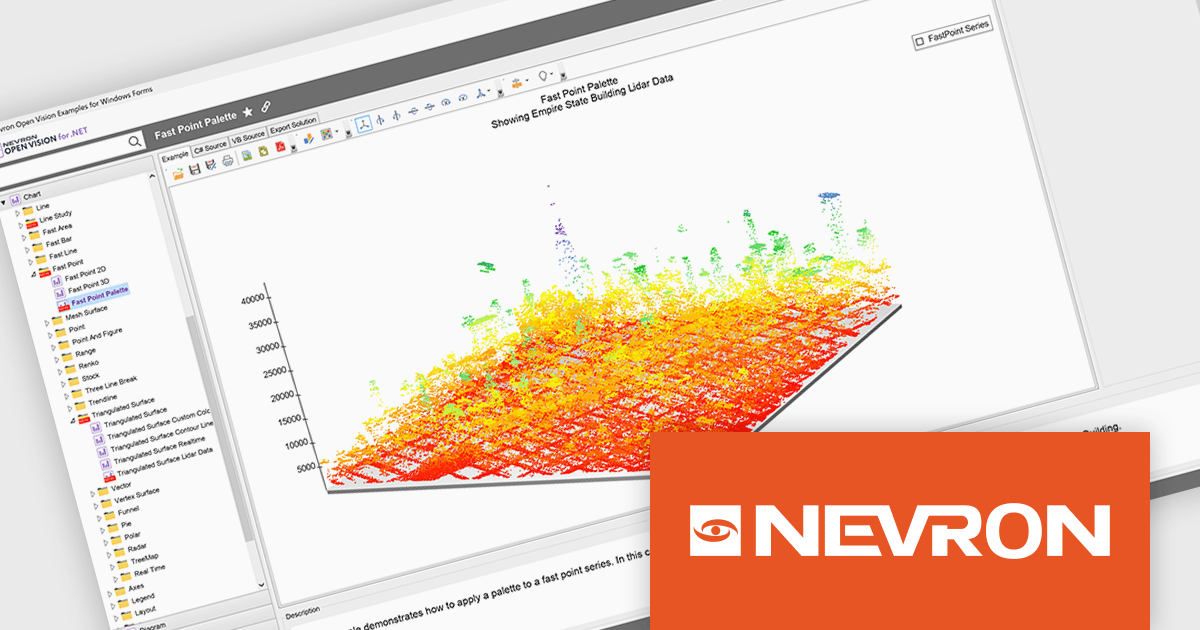
NOV Chart for .NET by Nevron is a comprehensive .NET charting component suite designed for cross-platform application development. It offers an array of 2D and 3D chart types, along with smart data labeling, an advanced chart axes model, numerous interactivity features and GPU-accelerated real-time rendering based on OpenGL. This library allows developers to seamlessly integrate rich, dynamic and interactive business, scientific, financial and presentation data visualizations into their .NET applications for more effective communication.
The NOV Chart for .NET 2026.1 update introduces a new Palette Fill Mode for Fast Area, Fast Bar, Fast Line, and Fast Point Series, giving developers greater control over how colors are applied across high performance charts. This enhancement makes it easier to create visually consistent and professionally styled data visualizations while reducing the effort required to maintain a unified appearance across multiple chart types. The added flexibility helps developers produce clearer dashboards, reporting interfaces, and analytics applications that better align with application branding and design requirements.
To see a full list of what's new in 2026.1, see our release notes.
NOV Chart for .NET is licensed per developer and is available as a perpetual license with 1 year support and maintenance. See our NOV Chart for .NET licensing page for full details.
NOV Chart for .NET is available in the following products:
聯繫電話: (888) 850 9911
傳真: +1 770 250 6199


