


官方供應商
我們作為官方授權經銷商,直接提供超過200家開發廠家所發行超過1000個的產品授權給您。
請參閱我們所有的品牌。
Infragistics Ultimate is a comprehensive development toolkit designed to streamline the creation of high-performance, visually rich applications across multiple platforms. It includes a wide range of user interface (UI) components and development tools for web, desktop, and mobile applications, supporting frameworks such as Angular, React, Blazor, .NET, and more.
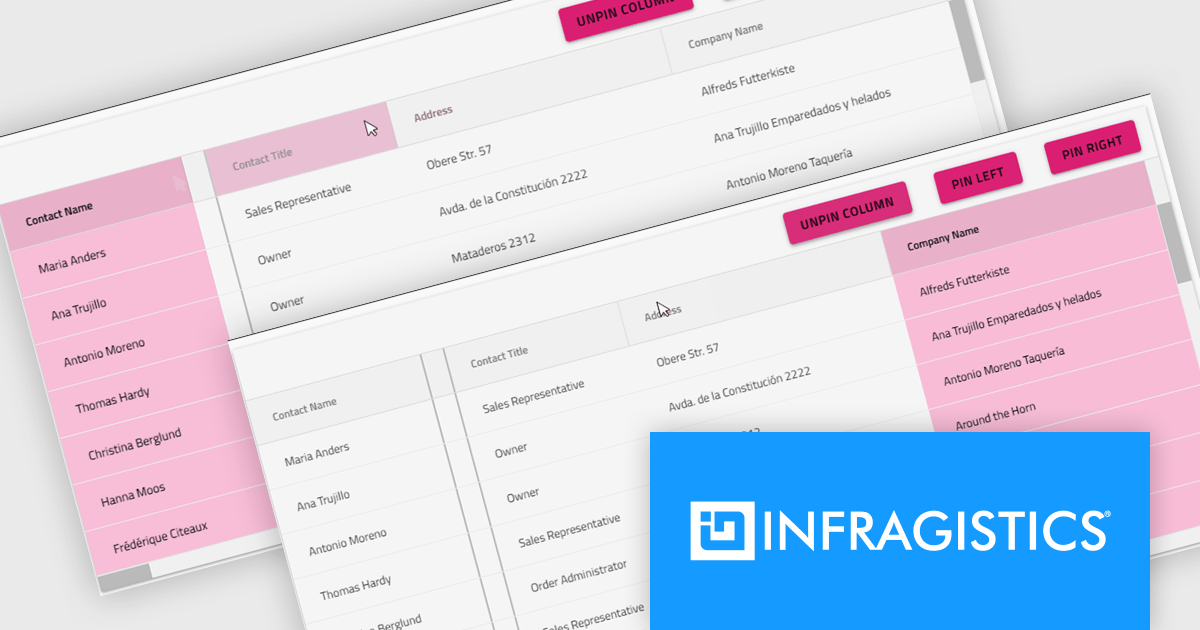
The Infragistics Ultimate 25.2 release includes a feature that lets developers specify individual pinning locations for each grid column, making it possible to fix important data on both the left and right edges of a grid. This added flexibility helps create cleaner, more efficient layouts that keep key information visible at all times. Whether you’re working in Angular, React, Web Components, or Blazor, this capability improves data presentation, simplifies large dataset navigation, and enhances the overall usability of modern web applications.
To see a full list of what's new in version 25.2, see our release notes.
Infragistics Ultimate is licensed per developer and is available as a Perpetual License with a 1, 2 or 3 year support and maintenance subscription. See our Infragistics Ultimate licensing page for full details.
For more information, visit our Infragistics Ultimate product page.
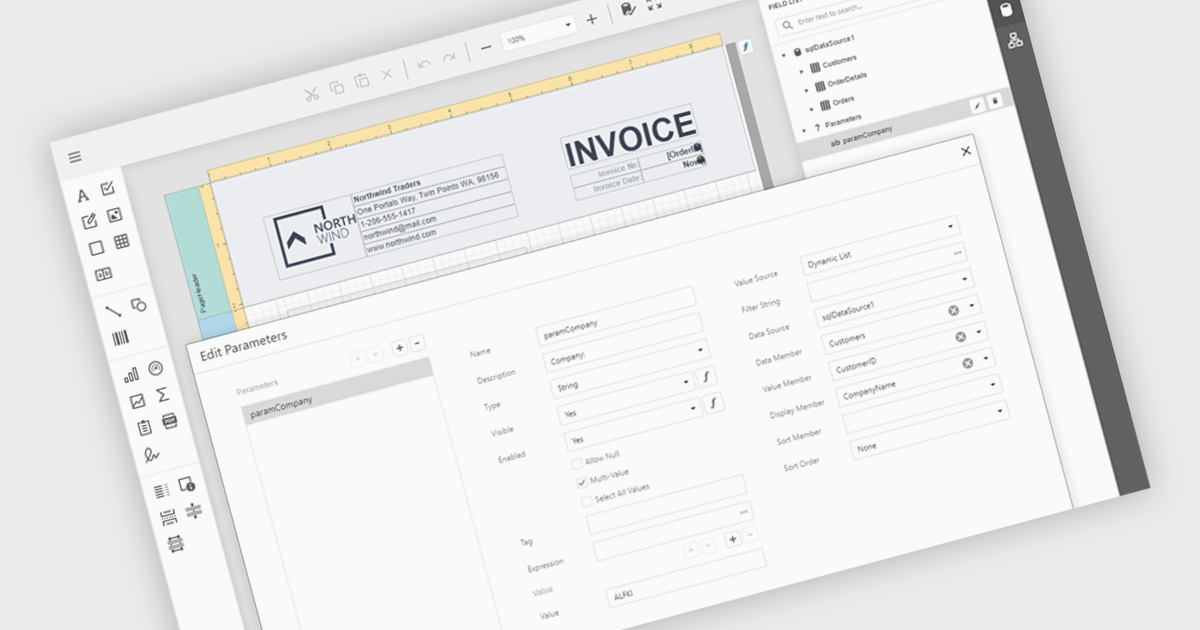
Data filtering and grouping in reporting help users organize and analyze information more efficiently by showing only the data that matters most. Filtering refines report results based on specific criteria such as date, category, or value, while grouping arranges related data into clear sections for easier comparison. Together, they improve clarity, speed up analysis, and reveal meaningful patterns. For example, a sales manager can view current quarter transactions grouped by region, or a finance team can review expenses filtered by department for more accurate insights.
Several .NET Blazor reporting controls offer data filtering and grouping including:
For an in-depth analysis of features and price, visit our comparison of .NET Blazor Reporting Controls.
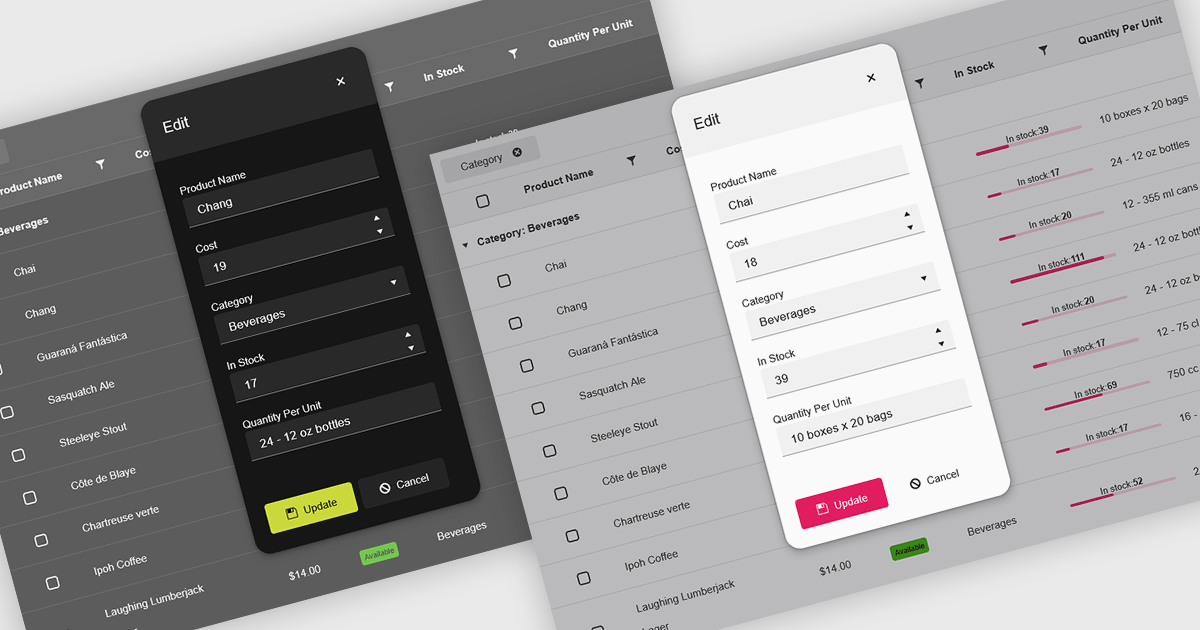
Themes in data editors provide a simple and efficient way to customize the visual appearance of data editing controls, including elements such as color schemes, fonts, and overall styling. By applying themes, developers and designers can create a consistent and professional look across multiple components, ensuring that applications align with brand guidelines and deliver a polished user experience. This flexibility enhances readability and usability while improving the design process, allowing visual updates to be made globally without modifying individual controls. For example, a dark theme can improve focus in data-intensive dashboards, while a light and minimalist theme can enhance clarity in business forms or reporting tools. Overall, themed data editors help maintain design consistency, reduce development time, and elevate the overall aesthetic of modern applications.
Several .NET Blazor data editor collections offer support for themes including:
For an in-depth analysis of features and price, visit our .NET Blazor data editor controls comparison.
DevExpress Blazor (part of DevExpress ASP.NET and Blazor) helps you create high-impact user experiences for both Blazor Server and Blazor WebAssembly using C#. The Blazor UI Component Library ships with a comprehensive set of native components (including a DataGrid, Pivot Grid, Scheduler, Chart, Data Editors and Reporting).
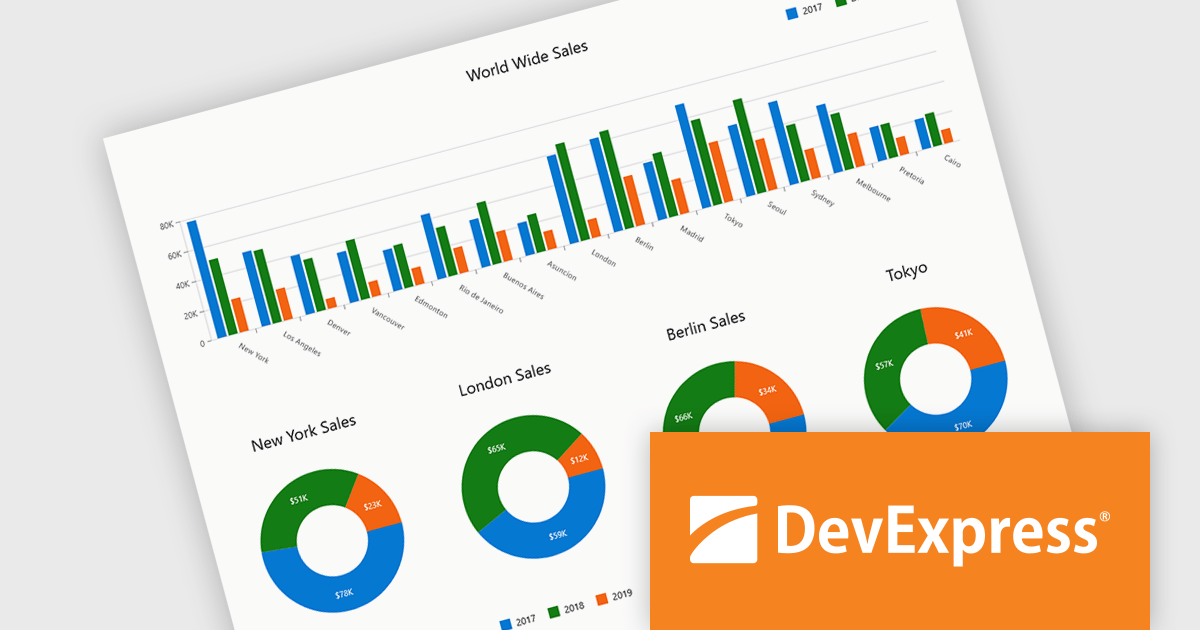
DevExpress Blazor provide comprehensive chart types that allow developers to present data in the most effective and readable format for any scenario. With support for a wide range of 2D chart options, including standard, stacked, and financial views, developers can accurately visualize trends, comparisons, and relationships within their applications. These charts integrate seamlessly into interactive dashboards, enabling real-time data analysis and clear visual storytelling. The flexibility of the chart types ensures precise data representation, while built-in export capabilities simplify sharing insights across platforms and reports, supporting the creation of professional, data-driven interfaces with minimal effort.
DevExpress ASP.NET and Blazor is licensed per developer and is available as a Perpetual License with a 12 month support and maintenance subscription. See our DevExpress ASP.NET and Blazor licensing page for full details.
DevExpress Blazor is available in the following products:
FastReport .NET Ultimate is a comprehensive reporting solution for developers working within the Microsoft .NET ecosystem. It supports the creation, design, and delivery of rich, interactive reports across Windows Forms, ASP.NET, MVC, and .NET Core applications. The Ultimate edition includes server deployment capabilities and extensive export options, such as PDF, Excel, Word, and HTML. It connects to various data sources, including SQL databases and business objects, providing flexibility for enterprise-level reporting. With the integrated FastReport Online Designer, users can edit reports directly in their browsers, enabling efficient collaboration and modern, full-featured report design across both desktop and web platforms.
The FastReport .NET Ultimate 2026.1 update introduces an improved Ribbon interface and a new 'RibbonDesignerControl', giving developers a more intuitive and efficient report design experience. The redesigned Ribbon UI offers a cleaner, more structured layout that simplifies access to tools and settings, improving usability and reducing development time. This addition allows developers to integrate the same modern Ribbon interface directly into their own applications, providing a consistent and familiar design environment for end users. This enhancement supports smoother workflows, greater customization, and a more professional user experience across both desktop and web reporting solutions.
To see a full list of what's new in version 2026.1, see our release notes.
FastReport .NET Ultimate is licensed per named user and is available as a perpetual license with a one-year subscription for updates and support. See our FastReport .NET Ultimate licensing page for full details.
For more information, visit our FastReport .NET Ultimate product page.
聯繫電話: (888) 850 9911
傳真: +1 770 250 6199


