


官方供應商
我們作為官方授權經銷商,直接提供超過200家開發廠家所發行超過1000個的產品授權給您。
請參閱我們所有的品牌。
繼續用英語閱讀:
amCharts 5: Stock Chart provides analytical tools for displaying time-based data, be it financial, stock or otherwise. It is a ready-made library that allows you to add interactive financial charts to a vast array of applications.
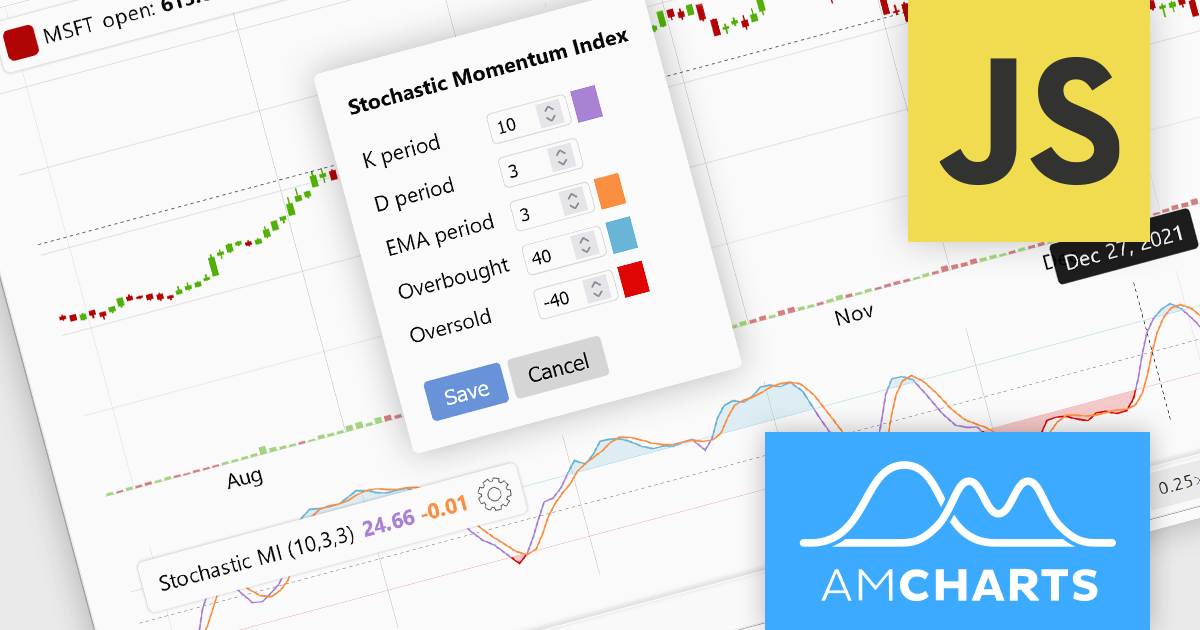
amCharts v5.5.3 adds built-in support for the Stochastic Momentum Index (SMI) to its bundled indicator control, allowing you to add the SMI to your charts via a simple user interface. This indicator reduces false signals by measuring the distance between the current closing price and the midpoint of the high/low price range. The SMI is a valuable technical indicator that can help traders identify potential trend reversals, capture momentum shifts, and make more informed trading decisions. Adding the SMI to your stock charts can help users gain a competitive edge in the market.
To see a full list of what's new in v5.5.3, see our release notes.
For more information, see our amCharts 5: Stock Chart product page.
聯繫電話: (888) 850 9911
傳真: +1 770 250 6199


