


官方供應商
我們作為官方授權經銷商,直接提供超過200家開發廠家所發行超過1000個的產品授權給您。
請參閱我們所有的品牌。
繼續用英語閱讀:
Infragistics Ultimate UI for Windows Forms and Infragistics Ultimate UI for WPF are comprehensive suites of UI controls designed to streamline development and enhance the user experience of desktop applications. Boasting over 100 components, they offer a rich set of functionalities, including data visualization tools, high-performance grids, and modern UI elements that mimic the look and feel of Microsoft Office. These feature-packed libraries empower developers to craft powerful, visually appealing applications with a consistent user experience.
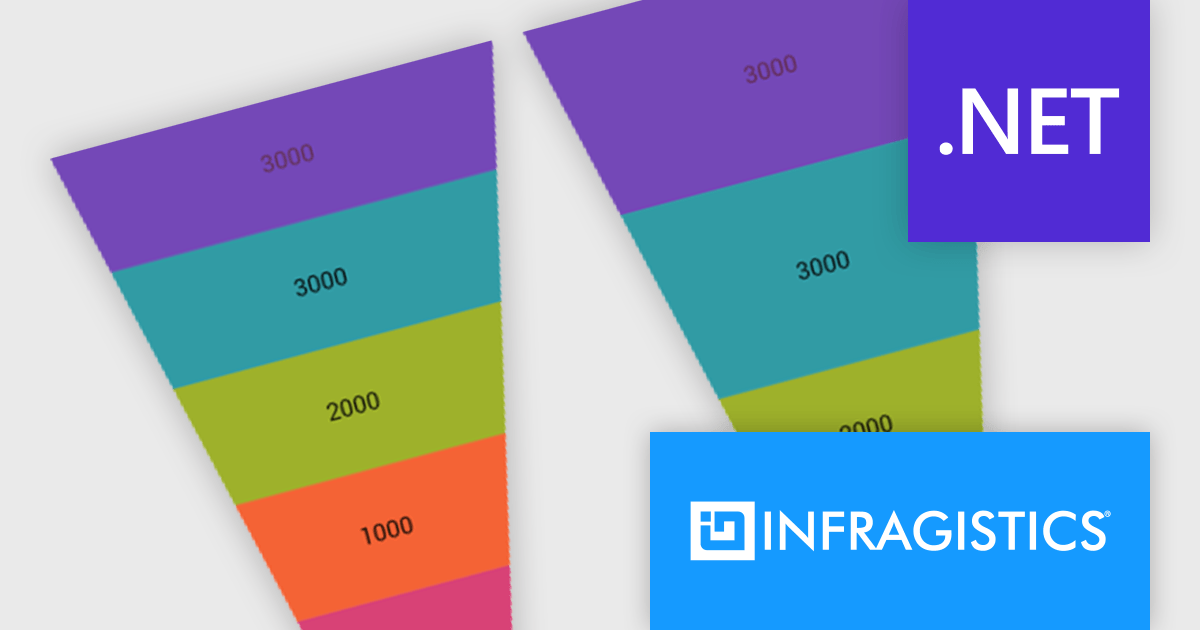
In the latest version, funnel charts can now display a special overlay to highlight specific sections. This highlighting feature allows you to compare the values of different stages in your funnel. You can also control the transparency of the overlay to emphasize the difference between the main data and the highlighted data.
To see a full list of what's new, see our release notes for Infragistics Ultimate UI for Windows Forms and Infragistics Ultimate UI for WPF.
Infragistics Ultimate UI for Windows Forms and Infragistics Ultimate UI for WPF are licensed per developer and are available as a Perpetual License with 1, 2 or 3 year support and maintenance subscription. See our Infragistics Ultimate UI for Windows Forms licensing page or Infragistics Ultimate UI for WPF licensing page for full details.
Infragistics Ultimate UI for Windows Forms is available to buy in the following products:
Infragistics Ultimate UI for WPF is available to buy in the following products:
聯繫電話: (888) 850 9911
傳真: +1 770 250 6199


