


官方供應商
我們作為官方授權經銷商,直接提供超過200家開發廠家所發行超過1000個的產品授權給您。
請參閱我們所有的品牌。
繼續用英語閱讀:
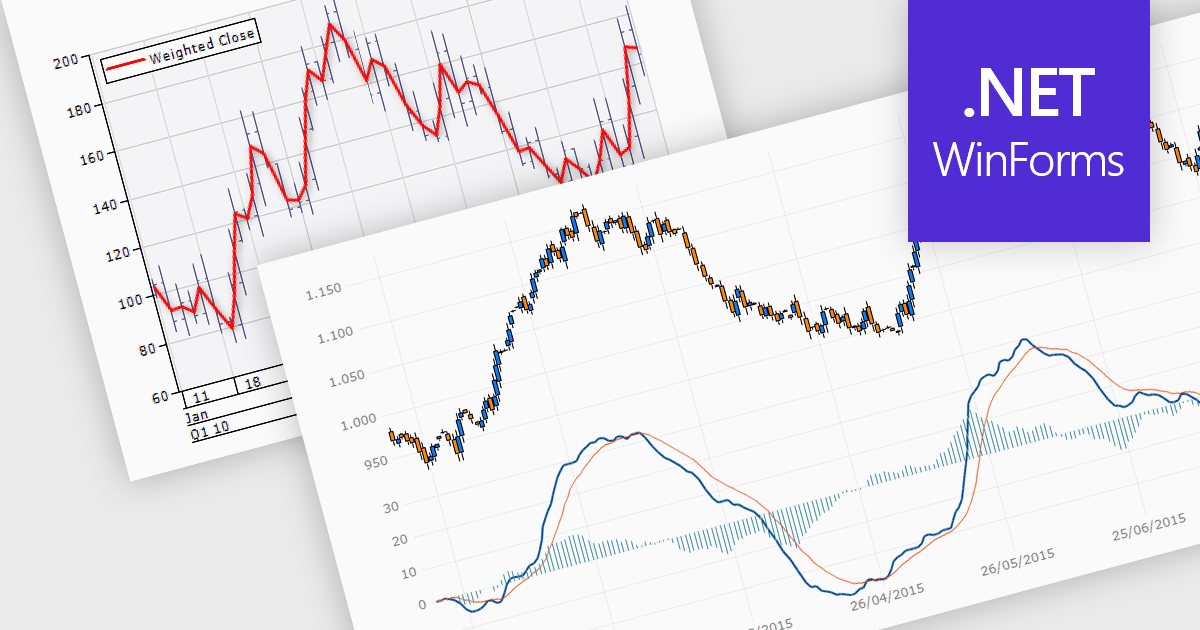
Trend lines are essential tools in data visualization and financial analysis, used to identify and interpret the direction and strength of trends in data sets. A trend line is a line that best represents the data on a chart, highlighting the general direction over a specified period. This is beneficial for making informed decisions, predicting future price movements, and validating the strength of ongoing trends. In stock market analysis, a trend line can help investors determine optimal entry and exit points, while moving averages can signal buy or sell opportunities, enhancing the effectiveness of trading strategies.
Several .NET WinForms chart controls offer trend lines and indicators including:
For an in-depth analysis of features and price, visit our comparison of .NET WinForms chart controls.
聯繫電話: (888) 850 9911
傳真: +1 770 250 6199


