


官方供應商
我們作為官方授權經銷商,直接提供超過200家開發廠家所發行超過1000個的產品授權給您。
請參閱我們所有的品牌。
繼續用英語閱讀:
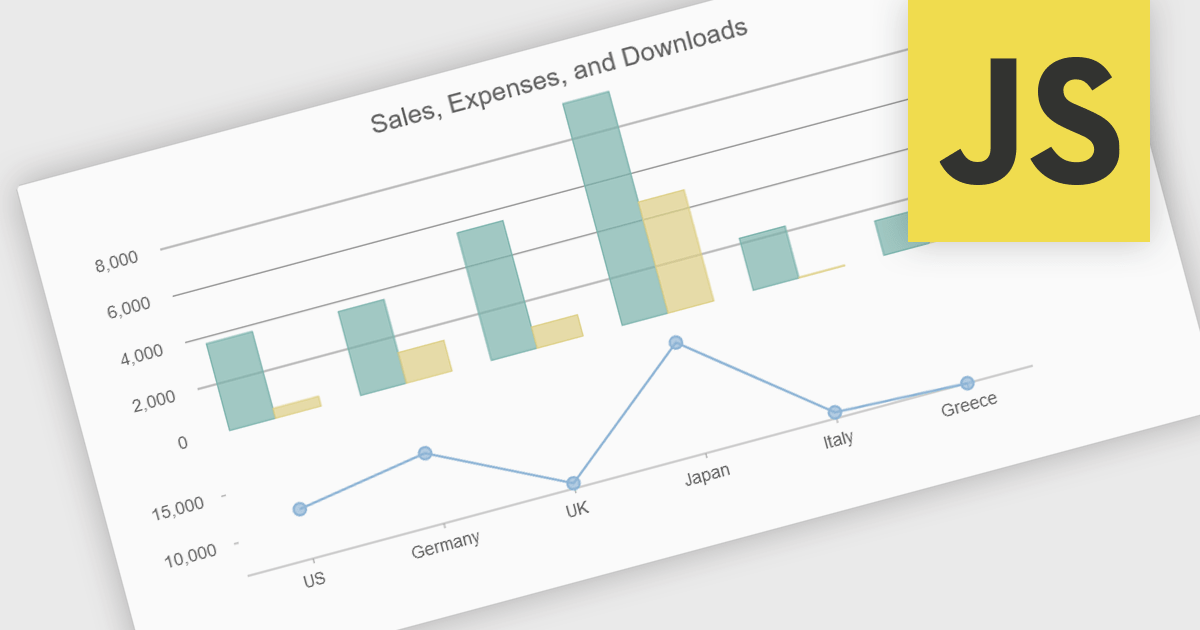
Combination charts (also known as combo charts) are visualizations that integrate multiple chart types, such as bar, line, and area charts, within a single display. This approach allows developers to show varied data sets and relationships in a cohesive, comprehensive manner, facilitating more nuanced data analysis and comparison. The primary benefits include their ability to convey complex information efficiently, their flexibility in showcasing different data trends simultaneously, and their enhanced readability for end-users who need to interpret diverse metrics at a glance. This versatility makes combination charts an invaluable tool for presenting multifaceted data insights in dynamic, interactive web applications.
Several JavaScript / HTML5 chart controls offer combination charts including:
For an in-depth analysis of features and price, visit our comparison of JavaScript / HTML5 Chart Controls.
聯繫電話: (888) 850 9911
傳真: +1 770 250 6199


