


官方供應商
我們作為官方授權經銷商,直接提供超過200家開發廠家所發行超過1000個的產品授權給您。
請參閱我們所有的品牌。
繼續用英語閱讀:
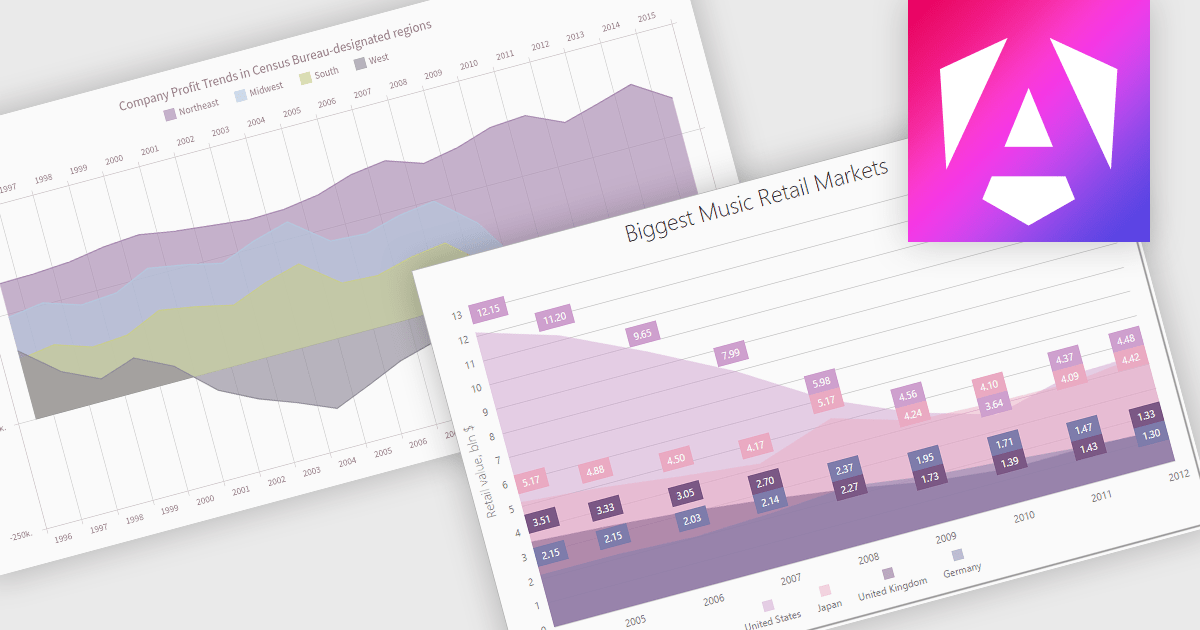
An area chart is a visualization tool that displays data as a filled area bounded by a line and the x-axis. It's particularly effective for illustrating trends and changes in data over time. By filling the area beneath the line, it visually represents the cumulative value of the data, making it easier to understand overall trends. This makes area charts ideal for visualizing metrics like sales over time, inventory levels, or stock prices.
Several Angular chart controls offer area charts including:
For an in-depth analysis of features and price, visit our Angular chart controls comparison.
聯繫電話: (888) 850 9911
傳真: +1 770 250 6199


