


官方供應商
我們作為官方授權經銷商,直接提供超過200家開發廠家所發行超過1000個的產品授權給您。
請參閱我們所有的品牌。
繼續用英語閱讀:
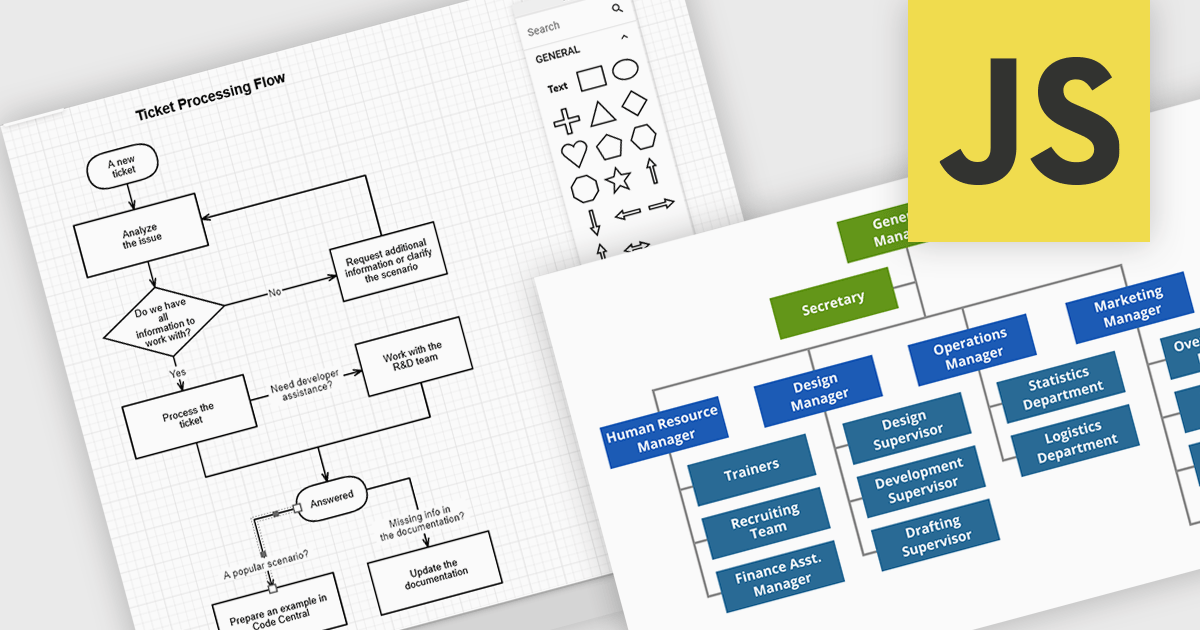
JavaScript diagramming components are libraries that enable developers to create interactive and dynamic diagrams in web applications. By offering customizable elements like nodes and connectors, they simplify the visualization of complex data, workflows, and processes. These components save development time and enhance user experience with pre-built tools for creating diagrams without the need for manual graphics handling. Common use cases include business process modeling, network architecture visualization, and organizational charts, making them ideal for applications requiring dynamic content and real-time collaboration.
Several JavaScript UI suites offer diagramming controls including:
For an in-depth analysis of features and price, visit our JavaScript UI suites comparison.
聯繫電話: (888) 850 9911
傳真: +1 770 250 6199


