


官方供應商
我們作為官方授權經銷商,直接提供超過200家開發廠家所發行超過1000個的產品授權給您。
請參閱我們所有的品牌。
繼續用英語閱讀:
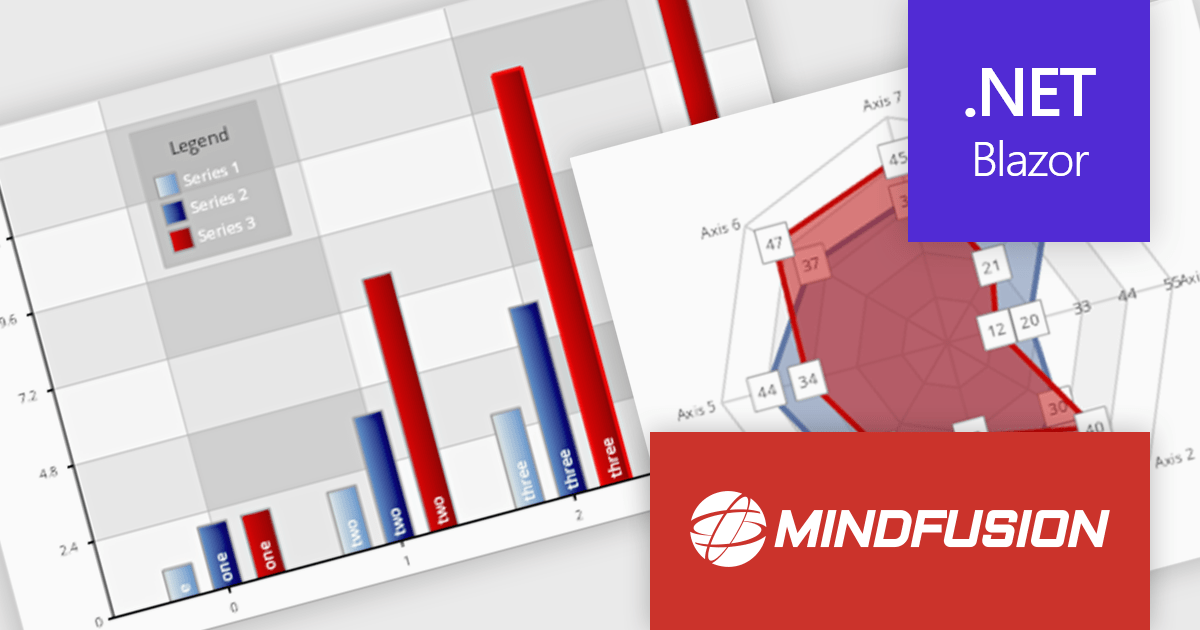
MindFusion.Charting for .NET Blazor is a robust solution that allows developers to effortlessly incorporate a diverse array of interactive and customizable charts and dashboards into Blazor applications. Supporting a wide range of chart types, from basic bar and line charts to more complex visualizations, it simplifies the creation of data-driven web applications. With flexible styling, user-friendly APIs, and smooth rendering, this library is perfect for building dynamic and visually engaging charting solutions in Blazor projects.
MindFusion Charting for .NET Blazor is ideal for building interactive, data-driven applications where dynamic visualization is key. It can be used for dashboards, reports, financial data analysis, performance tracking, and real-time monitoring. With its wide range of chart types, customization options, and user interaction features like pan, zoom, and hit testing, it enables developers to create intuitive, visually appealing interfaces for a variety of industries, including finance, healthcare, education, and business intelligence.
MindFusion.Charting for .NET Blazor is licensed per developer and is available as a perpetual license with 1 year subscription and support. See our MindFusion.Charting for .NET Blazor licensing page for full details.
For more information, visit our MindFusion.Charting for .NET Blazor product page.
聯繫電話: (888) 850 9911
傳真: +1 770 250 6199


