


官方供應商
我們作為官方授權經銷商,直接提供超過200家開發廠家所發行超過1000個的產品授權給您。
請參閱我們所有的品牌。
繼續用英語閱讀:
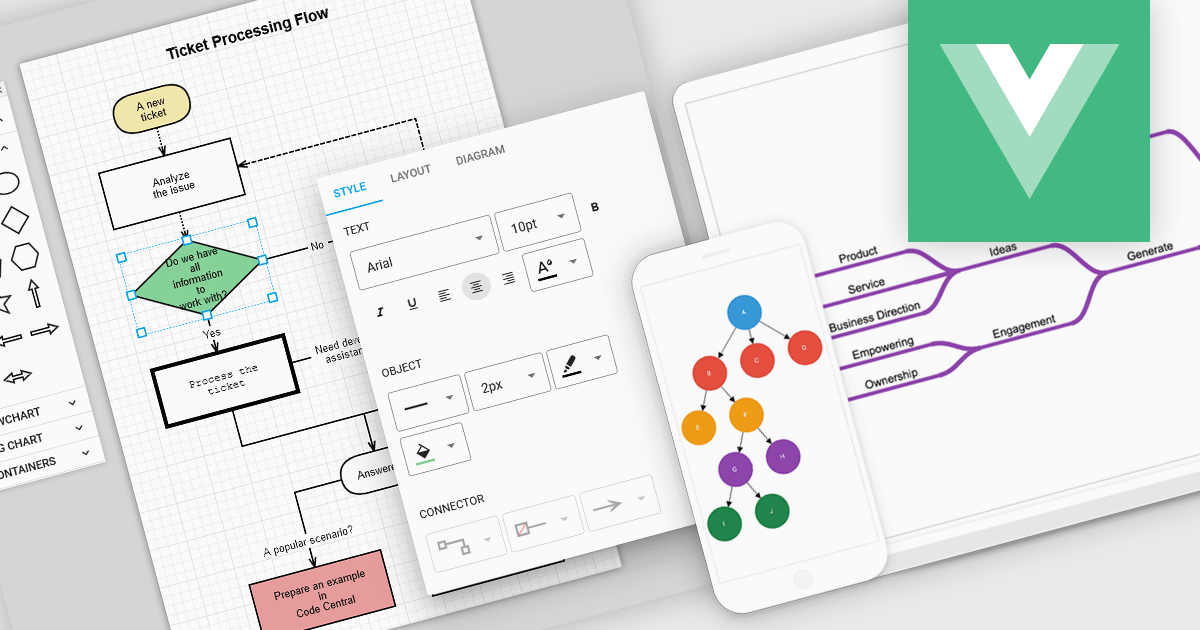
Vue diagrams are interactive visual representations, used to illustrate complex data structures, workflows, or system architectures. They leverage Vue's reactivity and component-based architecture to dynamically update as data changes, providing developers with an intuitive way to display and manage intricate relationships in real-time. Vue diagrams enhance the clarity of application logic, simplify debugging, and improve user experience by offering a clear, visual way to represent processes or data flows. This ultimately leads to more efficient development and better communication of complex concepts within the application.
Several Vue.js UI suites offer diagram controls including:
For an in-depth analysis of features and price, visit our Vue js UI suite comparison.
聯繫電話: (888) 850 9911
傳真: +1 770 250 6199


