


官方供應商
我們作為官方授權經銷商,直接提供超過200家開發廠家所發行超過1000個的產品授權給您。
請參閱我們所有的品牌。
繼續用英語閱讀:
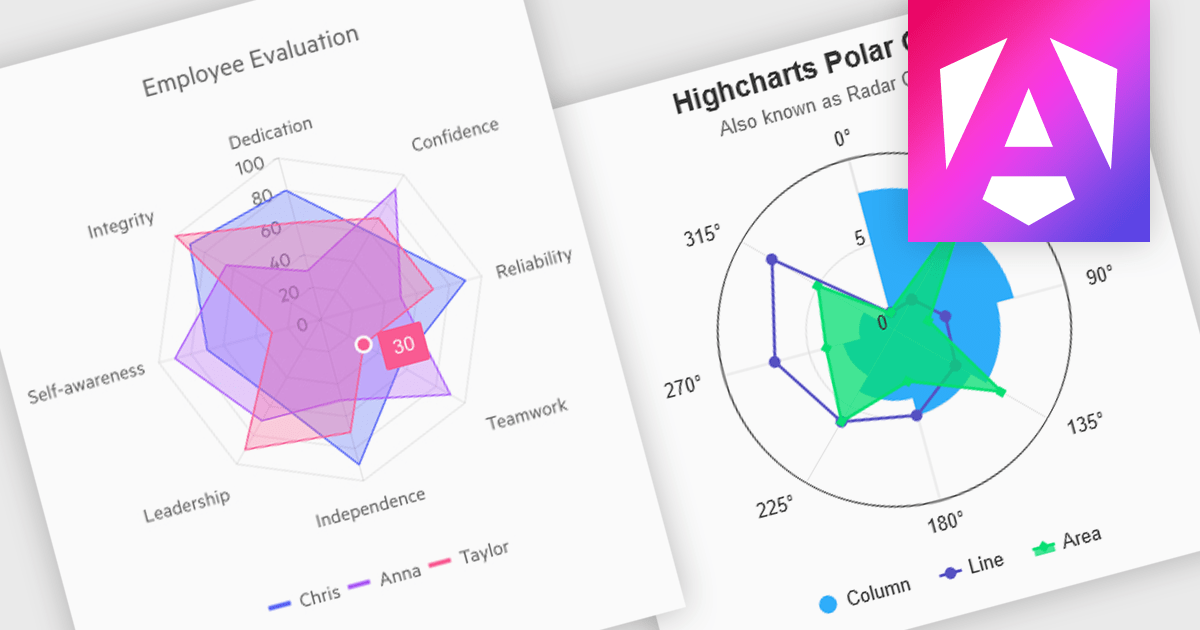
Polar and radar charts provide an intuitive way to visualize multidimensional and circular data. These chart types plot data points relative to a central axis, with polar charts ideal for showcasing proportional relationships, such as seasonal trends or directional metrics, and radar charts excelling at comparing multiple variables, such as performance metrics or skill assessments. Angular’s interactivity enhances engagement with features like tooltips, zooming and real-time updates, making these charts ideal for dashboards and reports. Use cases include analyzing skill assessments, market segmentation, and cyclic trends, delivering clear, actionable insights in a visually compelling format.
Several Angular chart controls offer visual polar and radar chart support including:
For an in-depth analysis of features and price, visit our Angular chart controls comparison:
聯繫電話: (888) 850 9911
傳真: +1 770 250 6199


