


官方供應商
我們作為官方授權經銷商,直接提供超過200家開發廠家所發行超過1000個的產品授權給您。
請參閱我們所有的品牌。
繼續用英語閱讀:
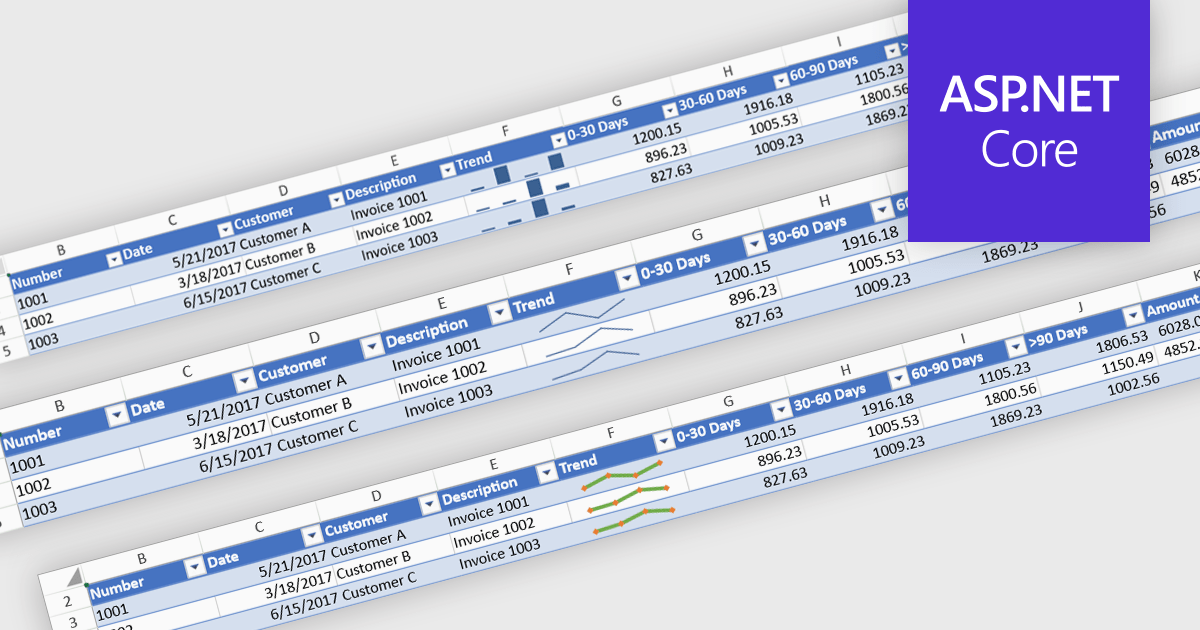
Sparklines are compact, embedded charts that provide a visual representation of data trends within individual spreadsheet cells. Unlike traditional charts, they do not require a separate charting area, making them ideal for summarizing data patterns, such as sales performance, stock trends, or operational metrics, in a space-efficient manner. These microcharts enhance readability and decision-making by offering a quick, at-a-glance view of trends without overwhelming users with excessive detail.
Several ASP.NET Core spreadsheet controls offer sparkline functionality including:
For an in-depth analysis of features and price, visit our ASP.NET Core spreadsheet controls comparison.
聯繫電話: (888) 850 9911
傳真: +1 770 250 6199


