


官方供應商
我們作為官方授權經銷商,直接提供超過200家開發廠家所發行超過1000個的產品授權給您。
請參閱我們所有的品牌。
繼續用英語閱讀:
Spread.NET by MESCIUS is a powerful tool for building Excel-like applications in your .NET projects. It lets you create interactive spreadsheets, grids, dashboards, and even forms within WinForms, ASP.NET, and WPF applications. With its rich feature set, including a robust calculation engine, formula support, and Excel compatibility, Spread.NET empowers developers to build data analysis tools, budgeting apps, scientific dashboards, and more, all within the familiar .NET environment.
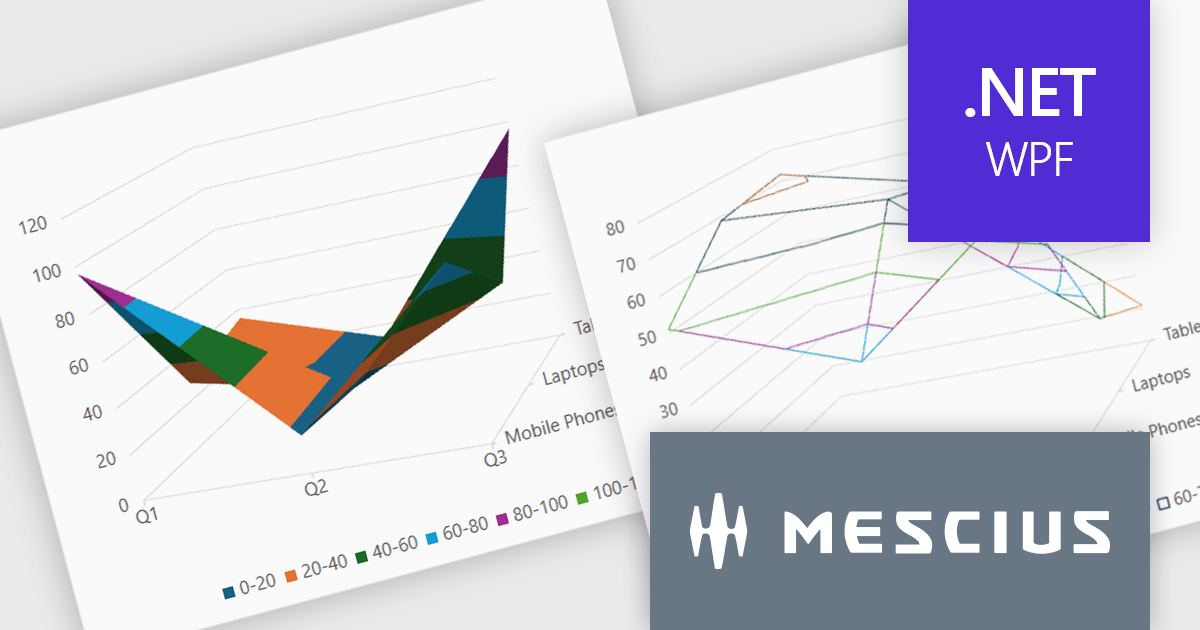
The Spread.NET v18.1 update introduces a new surface chart feature for WPF, providing developers with the capability to render spreadsheet data on a three-dimensional plane. By offering this advanced charting functionality, developers can create more sophisticated data visualization solutions within their WPF applications, allowing end-users to gain deeper insights into complex data and identify key correlations that may not be evident in two-dimensional representations. This feature expands the analytical tools available within Spread.NET, allowing for more nuanced and comprehensive data exploration.
To see a full list of what's new in v18.1, see our release notes.
Spread.NET is licensed per developer and is available as a Perpetual License with a 12 month support and maintenance subscription. We can supply any Spread.NET license including new licenses, maintenance renewals, and upgrade licenses. See our Spread.NET licensing page for full details.
For more information, visit our Spread.NET product page.
聯繫電話: (888) 850 9911
傳真: +1 770 250 6199


