


官方供應商
我們作為官方授權經銷商,直接提供超過200家開發廠家所發行超過1000個的產品授權給您。
請參閱我們所有的品牌。
繼續用英語閱讀:
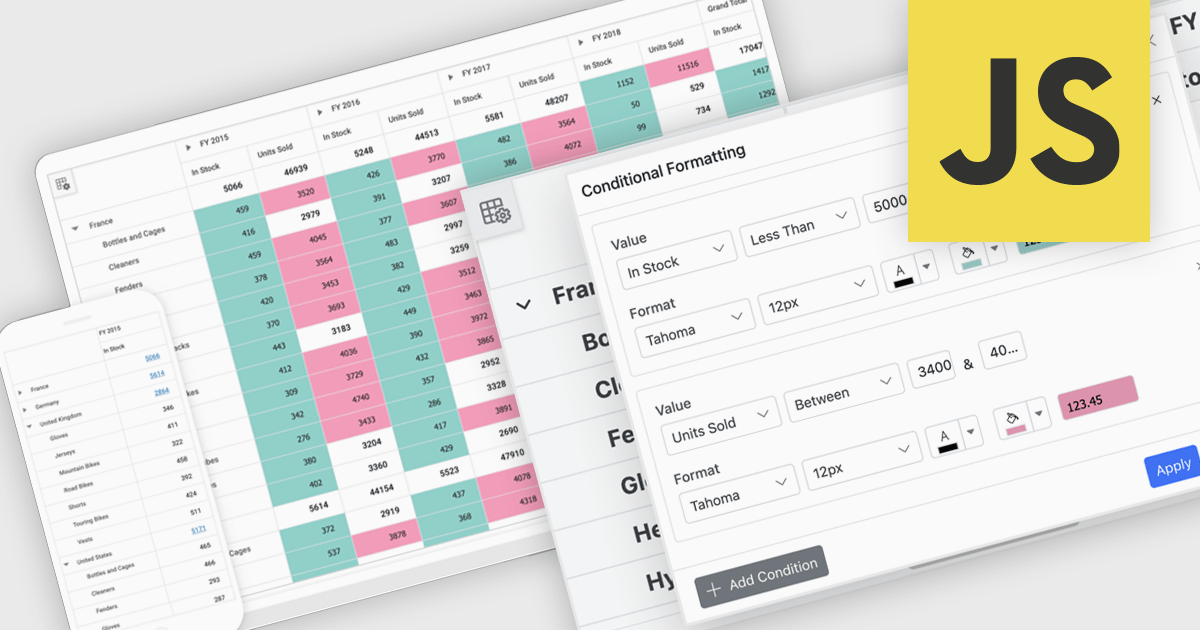
A pivot grid is a powerful data analysis tool that lets users quickly organize and summarize large datasets by rearranging rows, columns, and values. It simplifies reporting by allowing users to group, filter, and aggregate data to uncover patterns and trends. Pivot tables improve clarity, reduce manual calculations, and support flexible data exploration. Common use cases include analyzing sales by product or region, tracking departmental budgets, and creating summary reports for decision making.
Several JavaScript UI suites offer pivot grid components including:
For an in-depth analysis of features and price, visit our comparison of JavaScript UI suites.
聯繫電話: (888) 850 9911
傳真: +1 770 250 6199


