


官方供應商
我們作為官方授權經銷商,直接提供超過200家開發廠家所發行超過1000個的產品授權給您。
請參閱我們所有的品牌。
繼續用英語閱讀:
Stimulsoft Dashboards.JS is a JavaScript-based tool for creating interactive dashboards within web applications. Designed for developers and businesses, it provides customizable charts, graphs, and tables to visualize complex data from various sources. It supports popular JavaScript frameworks such as React, Vue.js, and Node.js, enabling seamless integration into modern web projects. With an intuitive interface and responsive design, it suits use cases like business intelligence, performance monitoring, and data-driven decision-making. Stimulsoft Dashboards.JS enhances user engagement and simplifies data analysis for industries such as finance, marketing, and logistics.
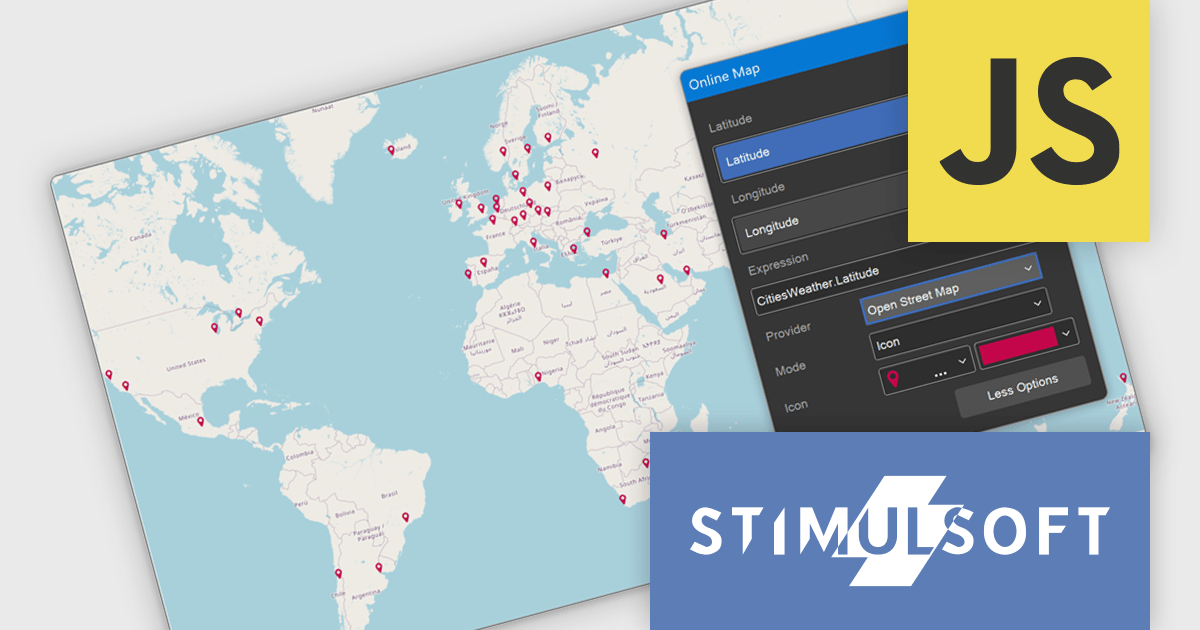
The Stimulsoft Dashboards.JS 2025.3.1 update introduces OpenStreetMap as the new default provider for the Online Map dashboard element, enabling developers to implement advanced geospatial visualizations without relying on external API keys. OpenStreetMap offers comprehensive support for multiple visualization modes, including icon, bubble, value, chart, and heat map, allowing for flexible and dynamic data presentation directly within dashboards. With this enhancement, developers gain a reliable, fully integrated mapping solution that aligns with open-source standards and simplifies deployment across projects.
To see a full list of what's new in 2025.3.1, see our release notes.
Stimulsoft Dashboards.JS is licensed per developer and is available as a Perpetual license with 1 year support and maintenance. See our Stimulsoft Dashboards.JS licensing page for full details.
Stimulsoft Dashboards.JS is available individually or as part of Stimulsoft Ultimate.
聯繫電話: (888) 850 9911
傳真: +1 770 250 6199


