


官方供應商
我們作為官方授權經銷商,直接提供超過200家開發廠家所發行超過1000個的產品授權給您。
請參閱我們所有的品牌。
繼續用英語閱讀:
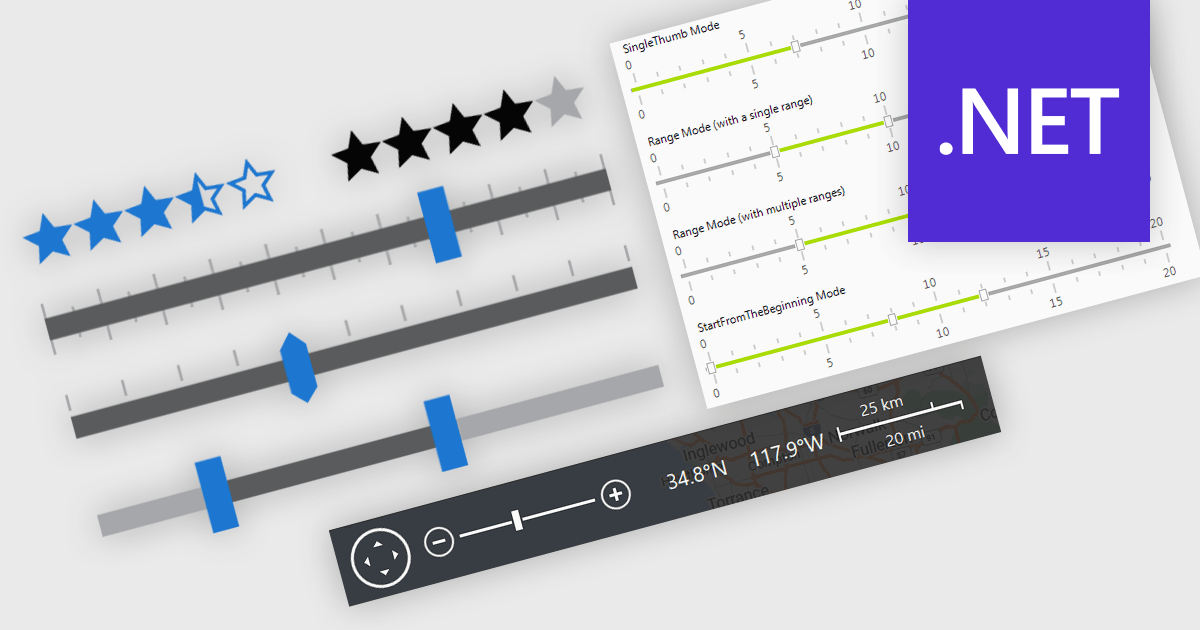
In .NET applications that require data editing, visual UI elements play a vital role in improving how users input and adjust data. For data entry such data visualization components as trackbars, range sliders, zoom controls, and rating elements offer an interactive alternative to text fields or dropdowns, making data input and feedback mechanisms more intuitive and precise. Whether it's setting numerical thresholds or filtering data sets based on user-defined limits, adjusting the view scale of charts, timelines, or graphical data displays, or quickly capturing feedback, these controls contribute to a more responsive and user-friendly interface. These components are especially valuable in scenarios that require fine-tuned input or subjective scoring, helping users make quick adjustments without disrupting the end-user's workflow.
Common features include:
For an in-depth analysis of features and price, visit our .NET data editors comparison.
聯繫電話: (888) 850 9911
傳真: +1 770 250 6199


