


官方供應商
我們作為官方授權經銷商,直接提供超過200家開發廠家所發行超過1000個的產品授權給您。
請參閱我們所有的品牌。
繼續用英語閱讀:
everviz is a cloud-based data visualization platform that helps users create visually appealing, interactive and customizable charts, maps, and other visuals. It provides a user-friendly interface that doesn't require any code or design skills, allowing users to quickly generate responsive visualizations with built-in support for accessibility. The platform provides the flexibility to embed these visualizations into web applications, or share them directly, and enables users to effectively engage with viewers across devices.
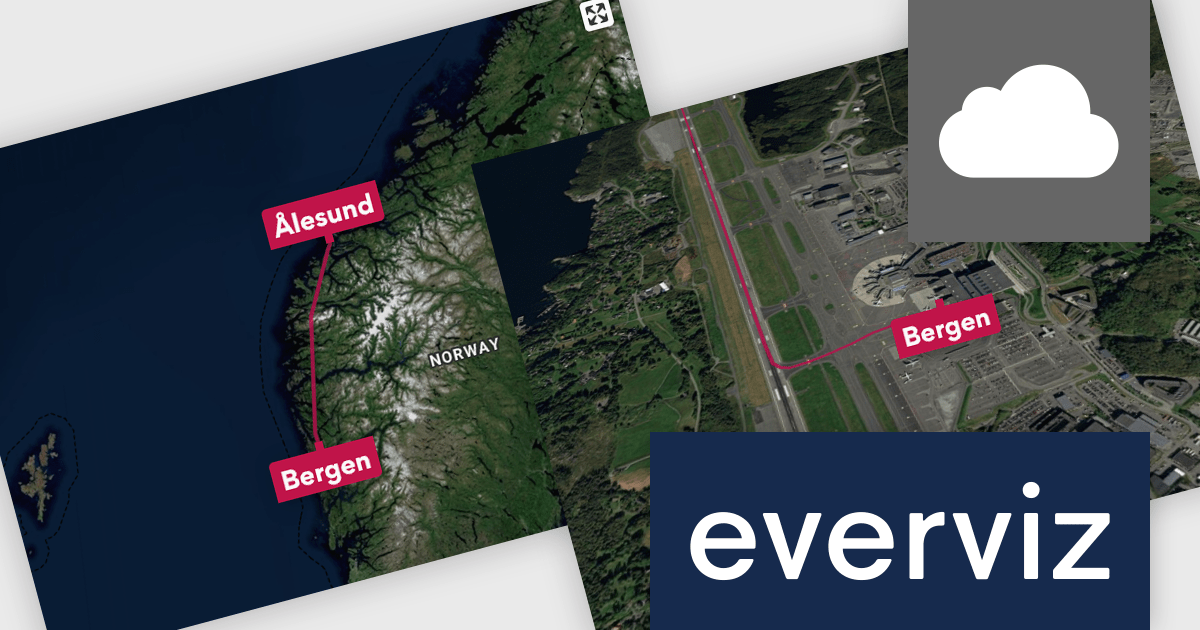
everviz has introduced file imports for animated maps, allowing developers to import GeoJSON, TopoJSON, KML, KMZ, and GPX files directly into their projects. This enhancement simplifies the integration of real-world geographic data into visualizations, enabling developers to create interactive and animated maps that represent routes, regions, and spatial patterns with greater accuracy. By removing the need for third-party GIS tools or manual data conversion, the feature increases efficiency and makes it easier to incorporate dynamic, data-driven maps into applications and reports.
everviz is available in two editions: Pro and Enterprise, both of which are annual subscription licenses that include support. See our everviz licensing page for full details.
For more information, see our everviz product page.
聯繫電話: (888) 850 9911
傳真: +1 770 250 6199


