


官方供應商
我們作為官方授權經銷商,直接提供超過200家開發廠家所發行超過1000個的產品授權給您。
請參閱我們所有的品牌。
繼續用英語閱讀:
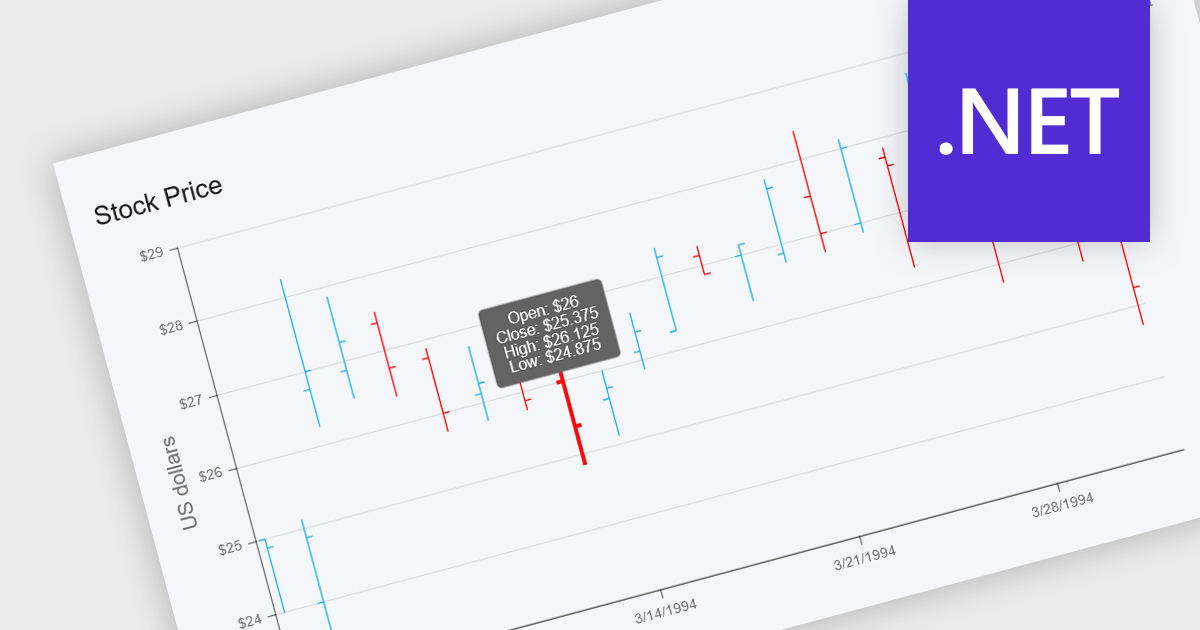
OHLC charts, short for Open-High-Low-Close charts, are a type of financial chart used to represent price movements of assets over a specific time period. Each point on the chart summarizes a single period's opening, highest, lowest, and closing prices, typically displayed using vertical bars with ticks to indicate opening and closing values. This format offers a clear and compact way to visualize volatility and market trends within a given timeframe. For developers and analysts working with financial data, OHLC charts are especially valuable for identifying price patterns, monitoring market behavior, and making informed decisions based on historical performance.
Several .NET chart components offer OHLC charts, including:
For an in-depth analysis of features and price, visit our comparison of .NET chart components.
聯繫電話: (888) 850 9911
傳真: +1 770 250 6199


