


官方供應商
我們作為官方授權經銷商,直接提供超過200家開發廠家所發行超過1000個的產品授權給您。
請參閱我們所有的品牌。
繼續用英語閱讀:
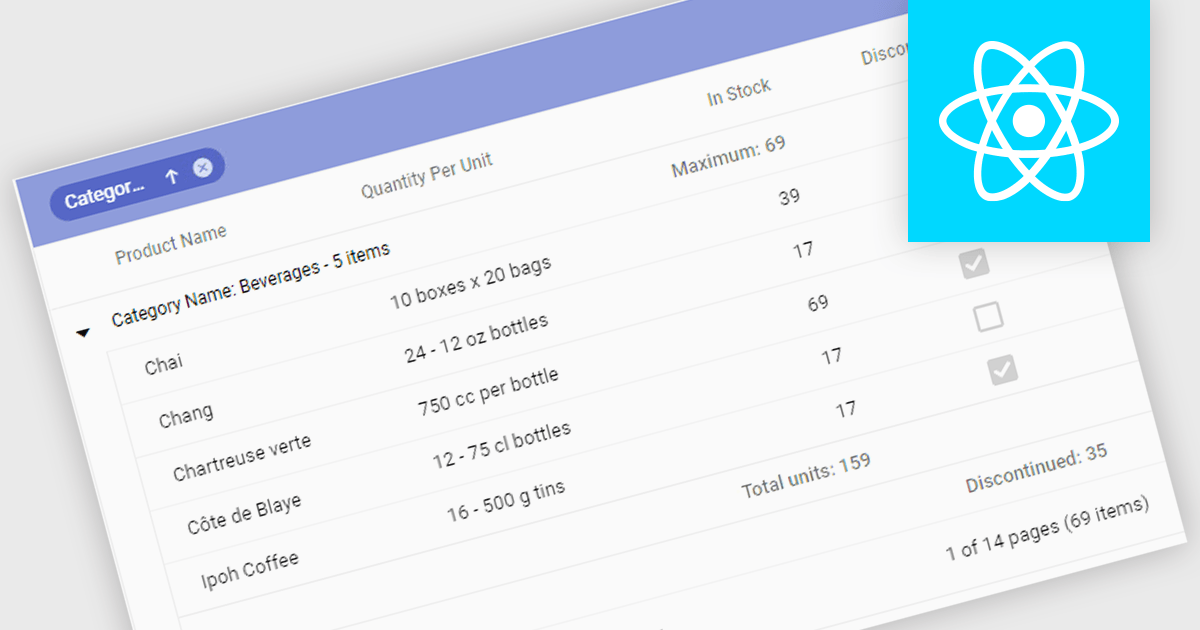
Aggregation in grids is the ability to automatically calculate summary values such as sums, averages, minimums, and maximums directly within tabular data views. By displaying these calculations alongside the underlying data, users can quickly understand trends, compare values, and identify outliers. This enables faster, more informed decision making. Typical use cases include showing total sales figures, calculating average performance metrics, tracking minimum and maximum thresholds, and summarizing financial, operational, or analytical data in real time within business applications.
Several React grid controls offer aggregation including:
For an in-depth analysis of features and price, visit our React grid controls comparison.
聯繫電話: (888) 850 9911
傳真: +1 770 250 6199


