


官方供應商
我們作為官方授權經銷商,直接提供超過200家開發廠家所發行超過1000個的產品授權給您。
請參閱我們所有的品牌。
繼續用英語閱讀:
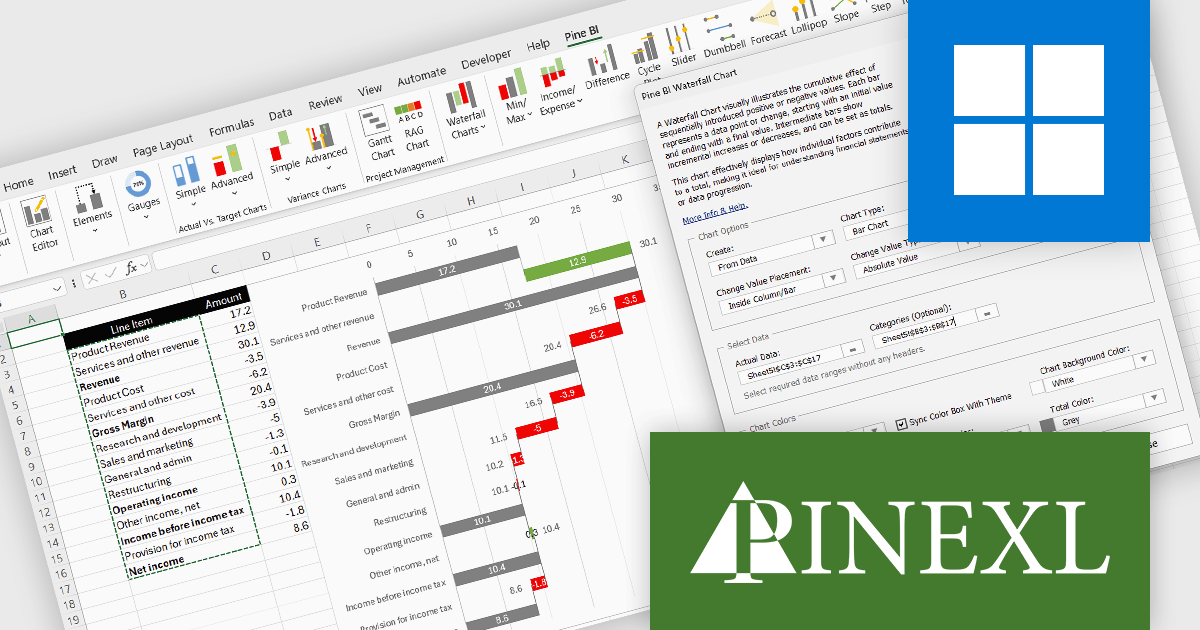
The Pine BI Excel Add-In facilitates the rapid generation of sophisticated and interactive Excel charts, enabling the transformation of standard workbooks into engaging dashboards that improve data visualization. These easily shareable visuals can also be integrated into Microsoft Word and PowerPoint, improving the creation of impactful reports and presentations across various business applications.
The Pine BI Excel Add-In v2.1 update improves waterfall chart functionality by introducing rebuilt formulas that support a cleaner and more consistent data structure. Instead of relying on automatically calculated totals that required blank fields, developers can now explicitly define which values act as totals within the dataset. This approach simplifies data preparation, removes the need for automatic final totals, and makes chart calculations more transparent and predictable. As a result, developers can create and maintain waterfall visualizations more efficiently, particularly when working with complex financial or analytical models.
To see a full list of what's new in v2.1, see our release notes.
Pine BI Excel Add-In is licensed annually on a subscription basis with 1, 5, and 10 seat options, requiring renewal for continued use and covering each concurrent computer, with the ability to transfer individual seat activation's as needed. See our Pine BI Excel Add-In licensing page for full details.
For more information, explore the Pine BI Excel Add-In product range.
聯繫電話: (888) 850 9911
傳真: +1 770 250 6199


