


官方供應商
我們作為官方授權經銷商,直接提供超過200家開發廠家所發行超過1000個的產品授權給您。
請參閱我們所有的品牌。
繼續用英語閱讀:
FusionCharts Suite XT is a collection of charting and mapping tools that helps developers create interactive and data-driven dashboards for their web and mobile applications. It provides a wide range of features, including over 100 chart types, data-driven maps, and a variety of customization options. FusionCharts Suite XT helps you visualize and present data in a clear and engaging way.
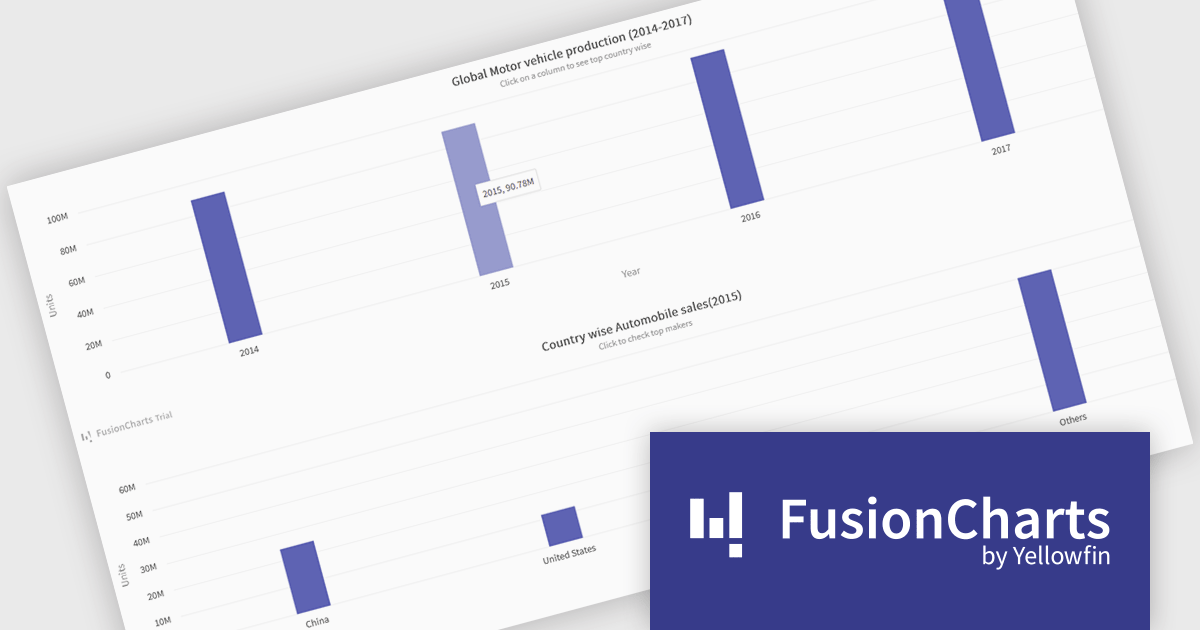
FusionCharts Suite XT allows developers to implement drill down charts that let users click individual data points to view related charts with more detailed information. This functionality helps developers present large or complex datasets in a structured way, allowing applications to display high level summaries while providing access to deeper data when required. By supporting multiple levels of drill down across most chart types, it supports scalable and interactive data exploration without overloading the initial visualization.
FusionCharts Suite XT is licensed through tiered plans, including Basic, Pro, Enterprise, and Enterprise+, available as annual or perpetual licenses for different developer and deployment needs. See our FusionCharts Suite XT licensing page for full details.
For more information, visit our FusionCharts Suite product page.
聯繫電話: (888) 850 9911
傳真: +1 770 250 6199


