













官方供應商
我們作為官方授權經銷商,直接提供超過200家開發廠家所發行超過1000個的產品授權給您。
請參閱我們所有的品牌。
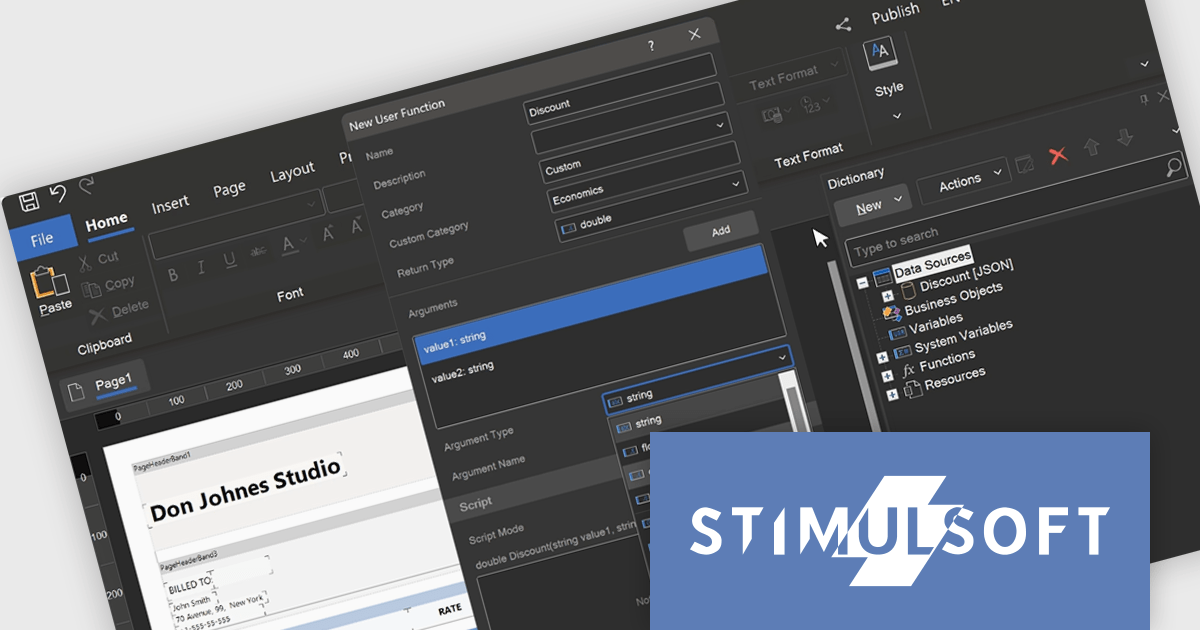
Stimulsoft Reports.WEB is a cross-platform reporting solution designed for integration within web applications. It leverages a client-server architecture for report generation, viewing, printing, and exporting directly in web browsers. Its powerful .NET report engine offers efficient report processing, a user-friendly HTML5 report designer for building reports with various data sources and visualizations, and an interactive HTML5 viewer for seamless report display within web applications. This integration allows developers to implement robust reporting functionalities without browser plugins or additional client-side dependencies.
The Stimulsoft Reports.WEB 2024.3 release empowers developers with user-defined functions within the data dictionary. This functionality extends report capabilities by allowing creation of custom logic using either the visual programming tool Blockly or directly in supported scripting languages. These user-defined functions can be seamlessly integrated into reports enabling developers to address complex calculations, data transformations, or custom formatting logic without code modifications in the main application. This streamlines development, promotes code reusability, and fosters a more dynamic reporting environment.
To see a full list of what's new in version 2024.3, see our release notes.
Stimulsoft Reports.WEB is licensed per developer and is available as a Perpetual license with 1 year support and maintenance. See our Stimulsoft Reports.WEB licensing page for full details.
Stimulsoft Reports.WEB is available in the following products:
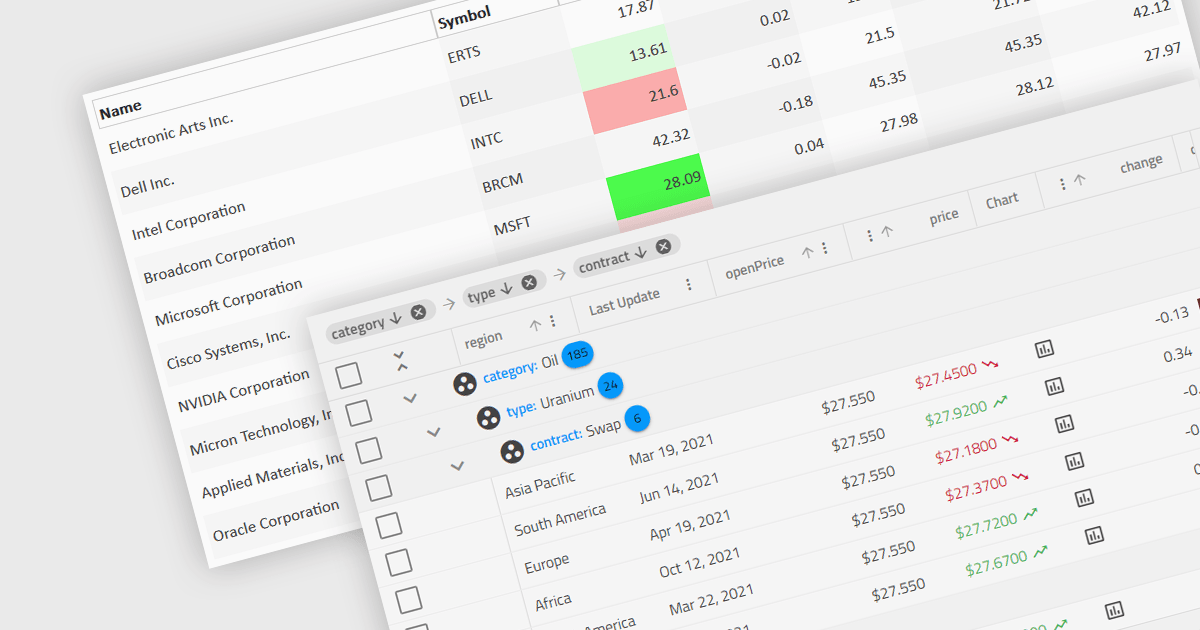
Dynamic updates, or live data rendering, in a data grid is the capability of the grid to automatically refresh and display updated data without the need for manual intervention or full-page reloads. This provides immediate access to the most current data and gives real-time reflections of changes. It therefore improves the user experience, enhancing data accuracy, and minimizing disruptions during data manipulation. Live data reduces the load on network resources by fetching only incremental data changes, and minimizes the computational burden on the client side, improving overall performance. This functionality is critical in applications where real-time data visibility is essential, such as in financial dashboards, live monitoring systems, or inventory management applications.
Several Angular grid components support dynamic updates, including:
For an in-depth analysis of features and price, visit our comparison of Angular grid components.
DevExtreme Complete by DevExpress is a collection of high-performance, pre-built UI components designed for web and mobile app development. It offers a rich set of widgets including data grids, charts, editors, and navigation tools that are responsive and work seamlessly across different browsers and devices. DevExtreme Complete allows developers to build feature-rich and user-friendly applications for modern web experiences.
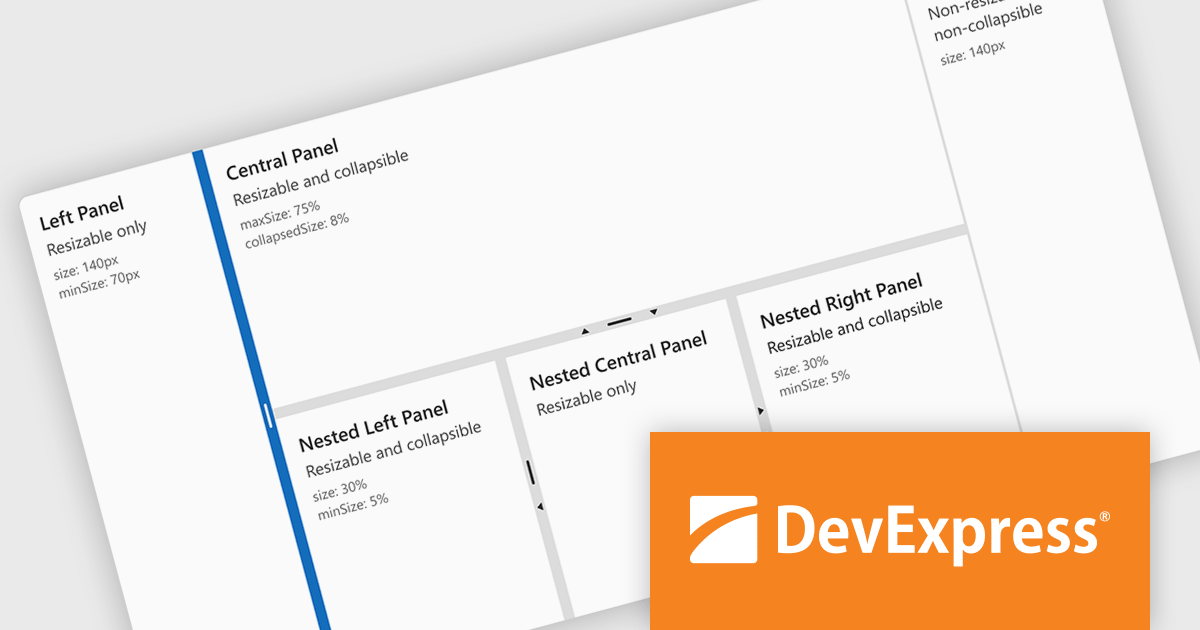
DevExtreme Complete 24.1 adds a new splitter component. This powerful addition allows you to create flexible page layouts with resizable and collapsible panes. Panes can be oriented horizontally or vertically and can contain various content types, including HTML and other DevExtreme components. The splitter offers customization options for handle size, appearance, and keyboard accessibility, making it a powerful tool for building adaptable web applications.
To see a full list of what's new in version 24.1, see our release notes.
DevExtreme Complete is licensed per developer and is available as a Perpetual License with a 12 month support and maintenance subscription. We can supply any DevExtreme Complete license including new subscriptions, subscription renewals, expired subscription renewals, and additional licenses. See our DevExtreme Complete licensing page for full details.
DevExtreme Complete is available to buy in the following products:
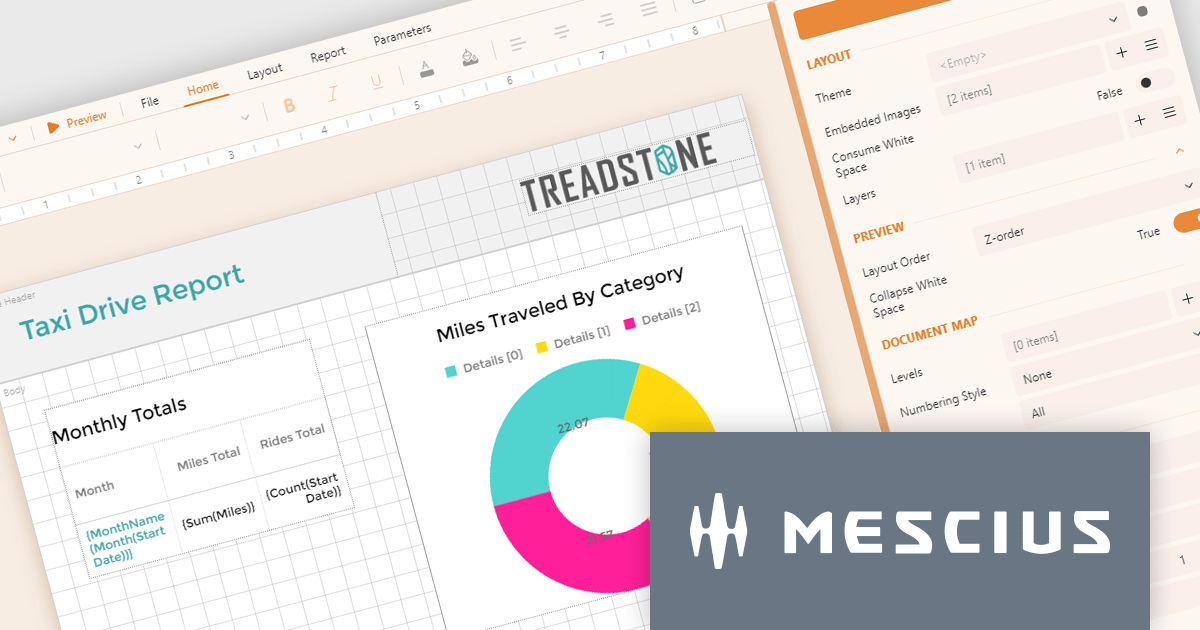
ActiveReportsJS by MESCIUS is a JavaScript reporting toolkit that empowers developers to design and embed interactive reports within web applications. It offers a standalone report designer for crafting reports and a JavaScript report viewer component for seamless integration into web frameworks like React or vanilla JavaScript. This solution streamlines report creation, facilitates data visualization, and delivers a user-friendly report experience.
The ActiveReportsJS 5.0 update modernizes the development experience by refreshing the look and feel of both the Report Designer and Report Viewer components with new icons and colors. This enhances clarity and consistency and improves the design environment. Improved theming capabilities empower you to effortlessly apply pre-defined themes or customize the designer's appearance to match your application's branding, fostering a more cohesive user experience within your web applications.
To see a full list of what's new in 5.0, see our release notes.
ActiveReportsJS is licensed on an annual subscription or perpetual basis and is available as a Single Deployment License for non-commercial use, and as a Single Domain License or Unlimited Domain License for commercial and/or SaaS use. See our ActiveReportsJS licensing page for full details.
Learn more on our ActiveReportsJS product page.
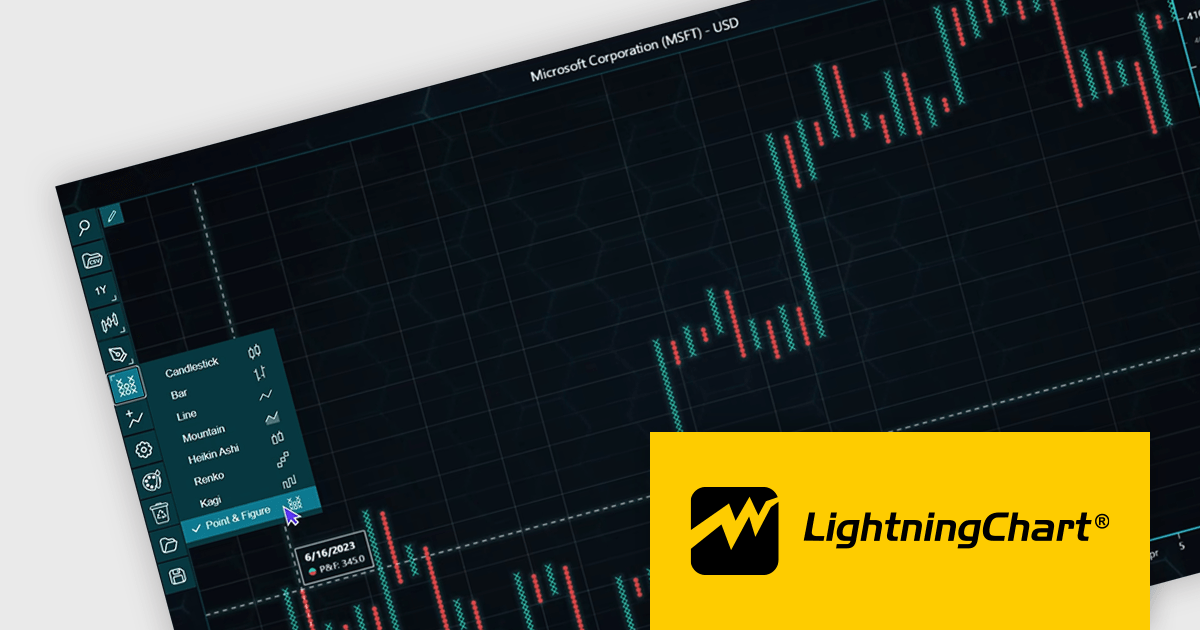
LightningChart JS Trader is a JavaScript/TypeScript library developed by LightningChart that specifically targets the creation of financial and trading applications. It provides high-performance, 2D, 3D, and real-time charting controls and a comprehensive suite of visualizations including candlestick, bar, line, and various technical indicators and drawing tools. This library enables software developers to craft interactive technical analysis tools without the need for server-side setup as it runs completely on the client device.
The LightningChart JS Trader v2.0 update expands its technical analysis toolkit by introducing more chart types, such as Heikin Ashi, Renko, Kagi, and Point-and-Figure charts. These additional chart types equip developers with a wider range of visualization options, significantly enhancing market trend analysis capabilities and allowing them to adapt to different analytical needs and trading strategies.
To see a full list of what's new in v2.0, see our release notes.
LightningChart JS Trader is licensed per developer and is available as an annual license with 1 year support. See our LightningChart JS Trader licensing page for full details.
For more information, see our LightningChart JS Trader product page.
聯繫電話: (888) 850 9911
傳真: +1 770 250 6199


