


官方供應商
我們作為官方授權經銷商,直接提供超過200家開發廠家所發行超過1000個的產品授權給您。
請參閱我們所有的品牌。
FusionCharts Suite XT is a JavaScript charting library that provides developers with a wide range of options for creating data visualizations. The suite includes over 100 chart types, 2,000+ maps, and a variety of features for customizing charts, adding interactivity, and exporting charts to different formats. It is used by developers of all skill levels to create data visualizations for a wide range of applications, including dashboards, reports, websites, and mobile apps.
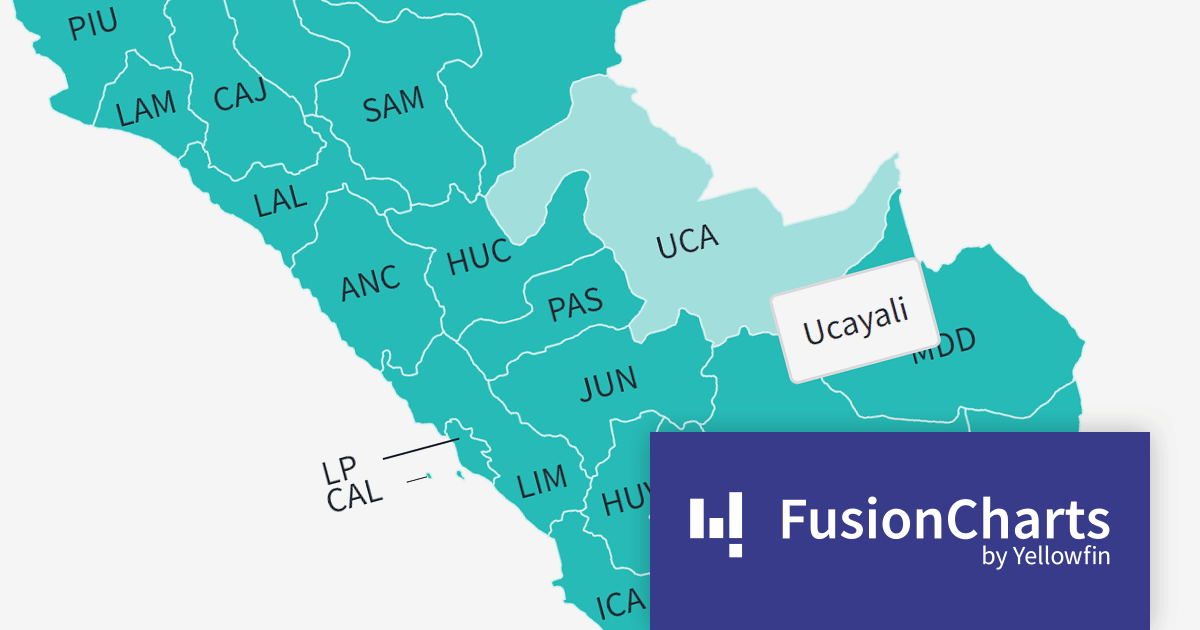
FusionCharts v3.21.0 introduces new maps for Argentina, Peru, and Costa Rica. With a total of 58 new maps, you can now drill down to each specific department within those countries. This version added all 27 Peruvian provinces, all 24 Argentinian provinces, and all 7 Costa Rican provinces.
There are many benefits to using maps in your data visualization apps. Maps are a great way to visualize spatial data, such as customer location, sales by region, or traffic patterns. You can also identify trends and patterns in your data that might otherwise be difficult to see. FusionCharts maps can be used to create interactive dashboards and reports that allow users to explore data in more depth. For example, users could click on different regions on a map to see more detailed information about sales in those regions.
To see a full list of what’s new in version 3.21.0, see our release notes.
For more information, visit our FusionCharts Suite XT product page.
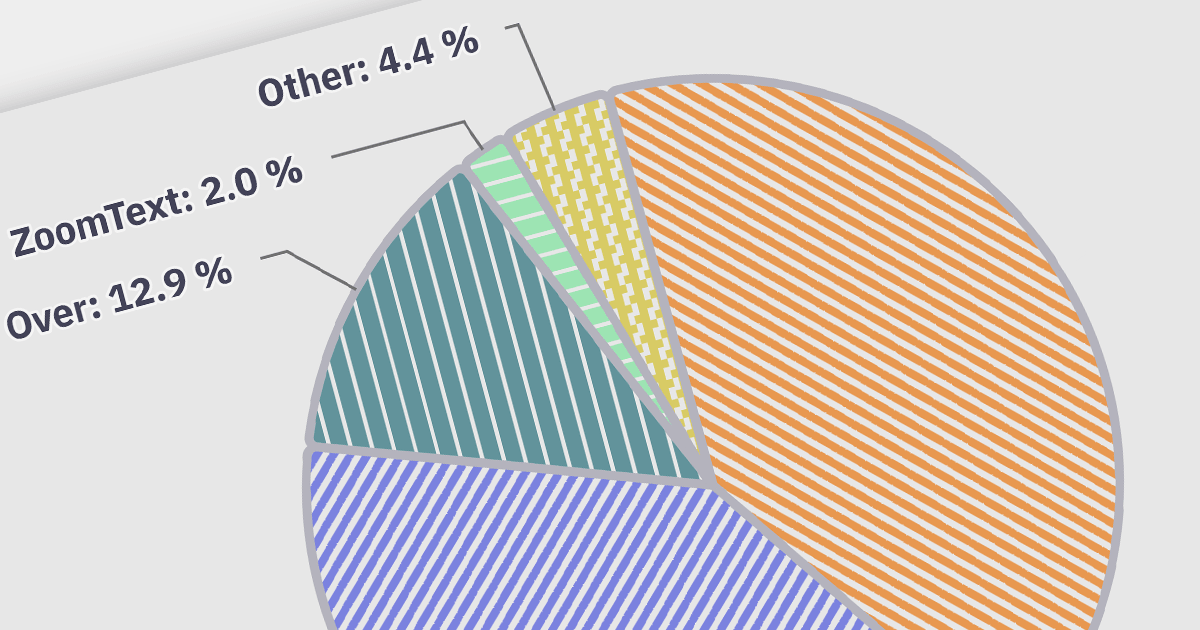
Accessibility features ensure that charts are usable by everyone, including people with disabilities. Examples include screen reader compatibility and keyboard navigation support. This ensures equal access to data visualizations, complying with accessibility standards, and enhancing user experience for all users.
Here is a selection of Angular charting components that provide accessibility features:
Many multi-function component suites also feature charting controls with accessibility support, including:
For an in-depth analysis of features and price, visit our comparison of Angular charts.
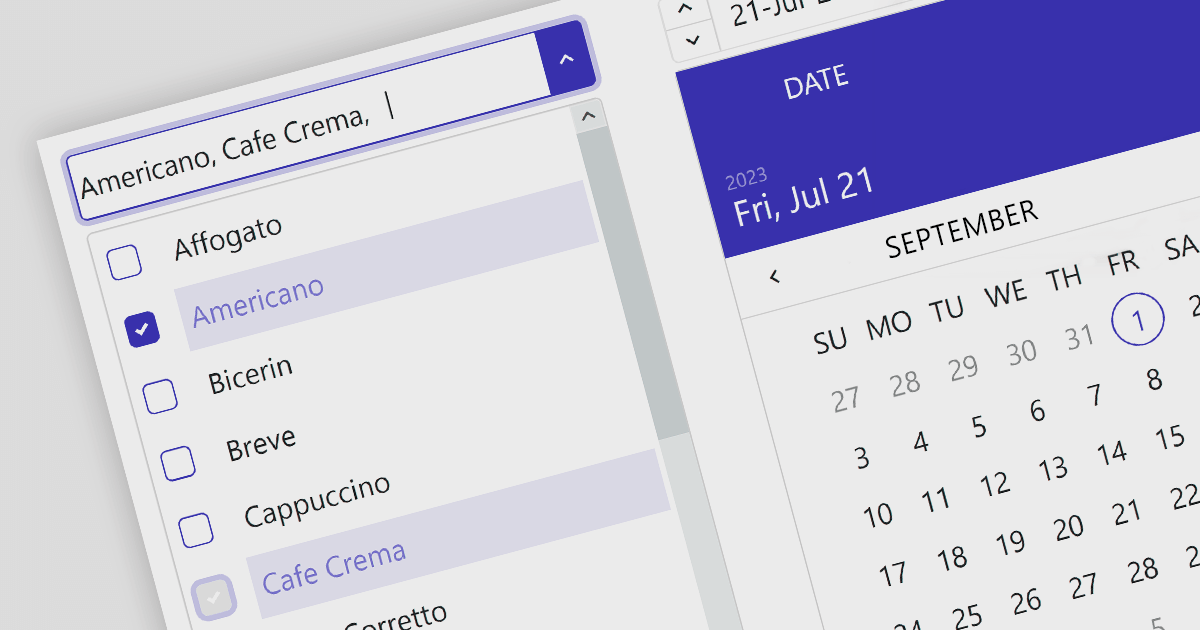
Angular data editors are user interface components that are used to display, manipulate, and validate data in Angular applications. Examples include toggle switches, checked list boxes and trackbars. They provide an interactive interface for users to easily edit data in forms, grids, or tables. These editors simplify data handling tasks and ensure data consistency and accuracy.
Here are some UI suites that include data editors:
For an in-depth analysis of features and price, visit our comparison of Angular UI suites.
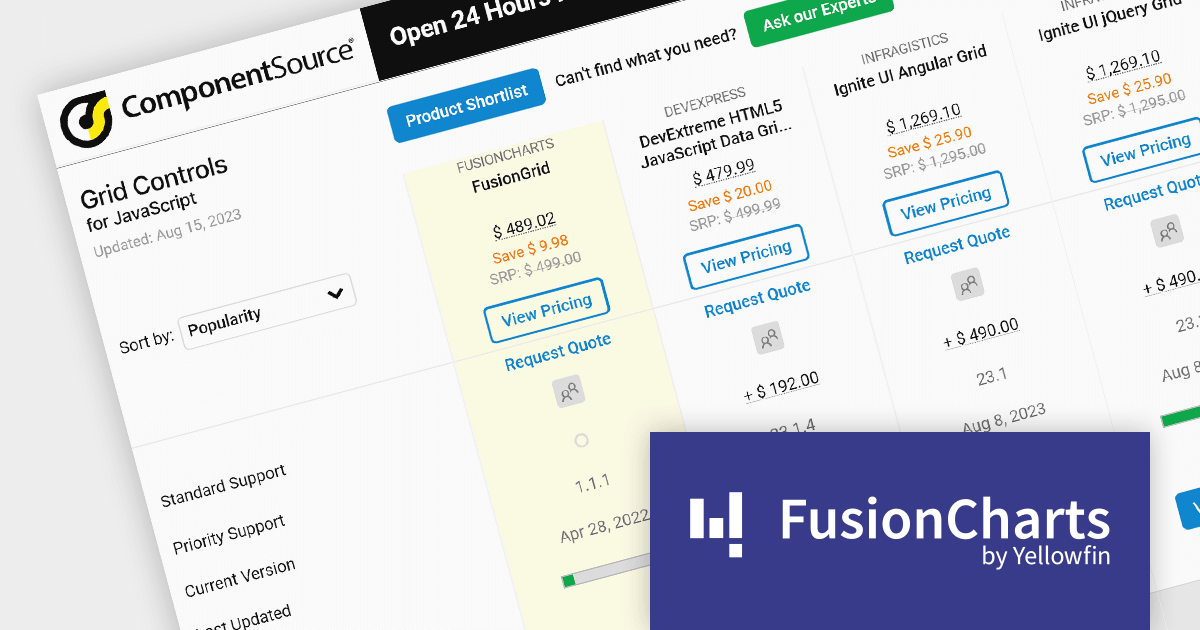
As the premier marketplace for software components and development tools, we are pleased to announce the addition of FusionGrid by FusionCharts to our JavaScript Grids Comparison. This latest inclusion further enriches the comparison tool's offerings, providing developers with a wider selection of high-performance grid components for their JavaScript projects.
FusionGrid is a customizable JavaScript data grid component developed by the team behind FusionCharts. It is designed for both Web and mobile applications, and allows you to build grids in dashboards with the same simplicity as FusionCharts. FusionGrid can be easily integrated with JavaScript front-end frameworks, such as Angular, React, and Vue.
FusionGrid is easy to use and customize, and has a well-documented API with numerous resources to help developers get started.
Our updated JavaScript Grids Comparison enables developers to evaluate FusionGrid with over 20 other popular grid components. It provides an in-depth analysis of each control's features, including supported cell types, export formats, data sources, and JavaScript framework support, as well as pricing and community reviews. With extensive sorting and filtering options, our comparison makes it easy to shortlist products and find the best grid control for your JavaScript project.
By incorporating FusionGrid into the comparison, we continue to ensure that developers have access to a comprehensive overview of the best grid components available in the market. This empowers developers to make informed decisions based on their specific requirements, ultimately saving time and effort in the selection process.
For an in-depth analysis of features and price, visit our comparison of JavaScript grids.
聯繫電話: (888) 850 9911
傳真: +1 770 250 6199


