


官方供應商
我們作為官方授權經銷商,直接提供超過200家開發廠家所發行超過1000個的產品授權給您。
請參閱我們所有的品牌。
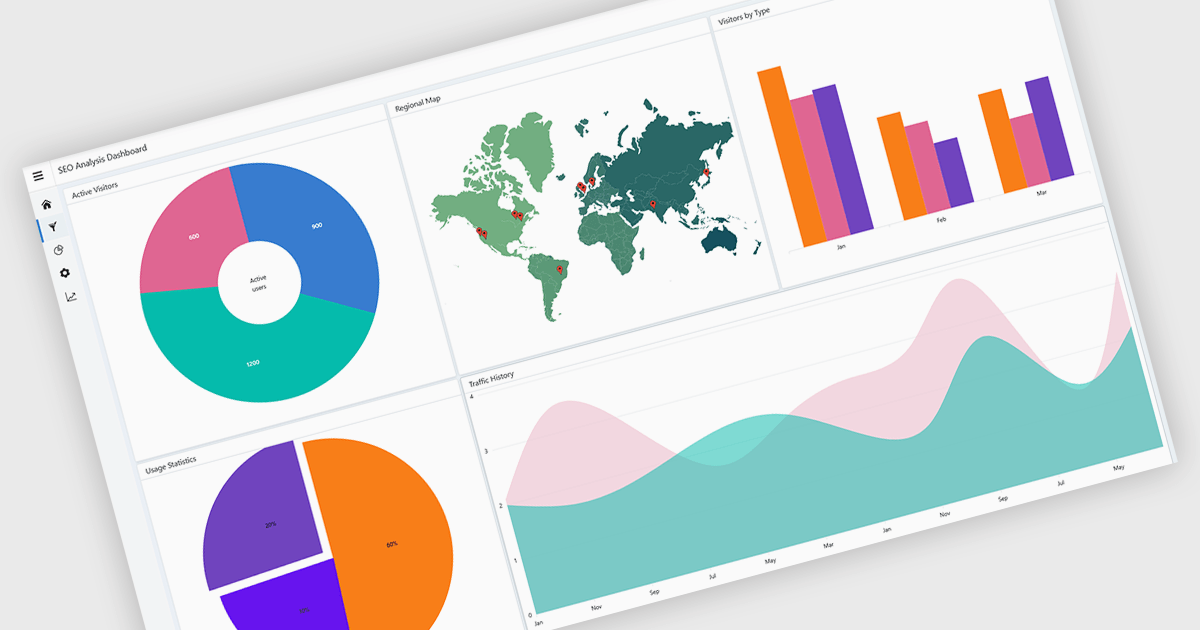
A layout component provides a structured foundation for building modern applications. It offers predesigned, configurable layout templates that ensure visual consistency, reduce development time, and eliminate common alignment or scalability issues by handling spacing, breakpoints, and component organization automatically. The result is a cleaner, more intuitive user experience across devices without requiring extensive custom CSS or layout logic. Common use cases include dashboards with resizable panels, master-detail views for data management, admin portals, and applications that need predictable, responsive page structures to support complex UI components like charts, forms, and data grids.
Several JavaScript UI suites offer layout components including:
For an in-depth analysis of features and price, visit our JavaScript UI suites comparison.
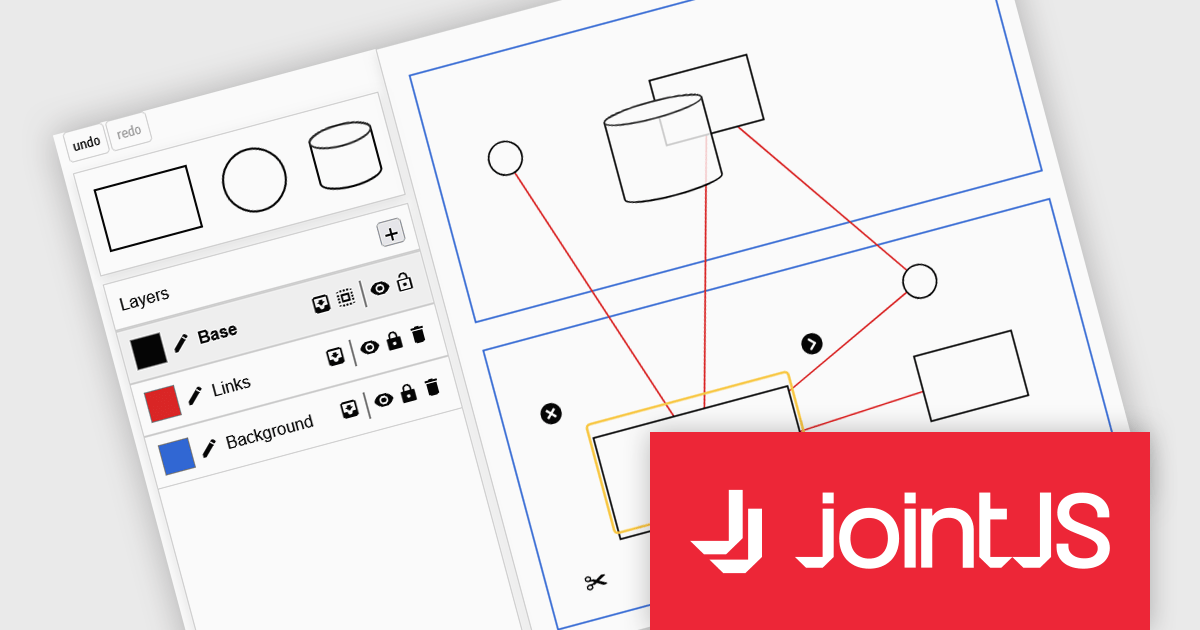
JointJS+ is a diagramming library that offers advanced features like custom shapes, data binding, and advanced layout algorithms, enabling you to create complex, interactive, and visually appealing diagrams. It includes a ready-to-use demo application that showcases its functionality and serves as a starting point for your own diagramming projects.
The JointJS+ 4.2 update introduces a redesigned Layers API that gives developers more control over diagram structure, interaction, and presentation by allowing cells to be grouped into independent layers with their own attributes, stacking context, and event flow. This enables clearer organization of complex graphs, more predictable z-index behavior, and the ability to apply targeted styling, filters, and animations at the layer level, all while maintaining backward-compatible event handling for smoother integration into existing applications.
To see a full list of what's new in v4.2, see our release notes.
JointJS+ is licensed per developer and is available as a Perpetual license with 1 year support and maintenance. See our JointJS+ licensing page for full details.
Learn more on our JointJS+ product page.
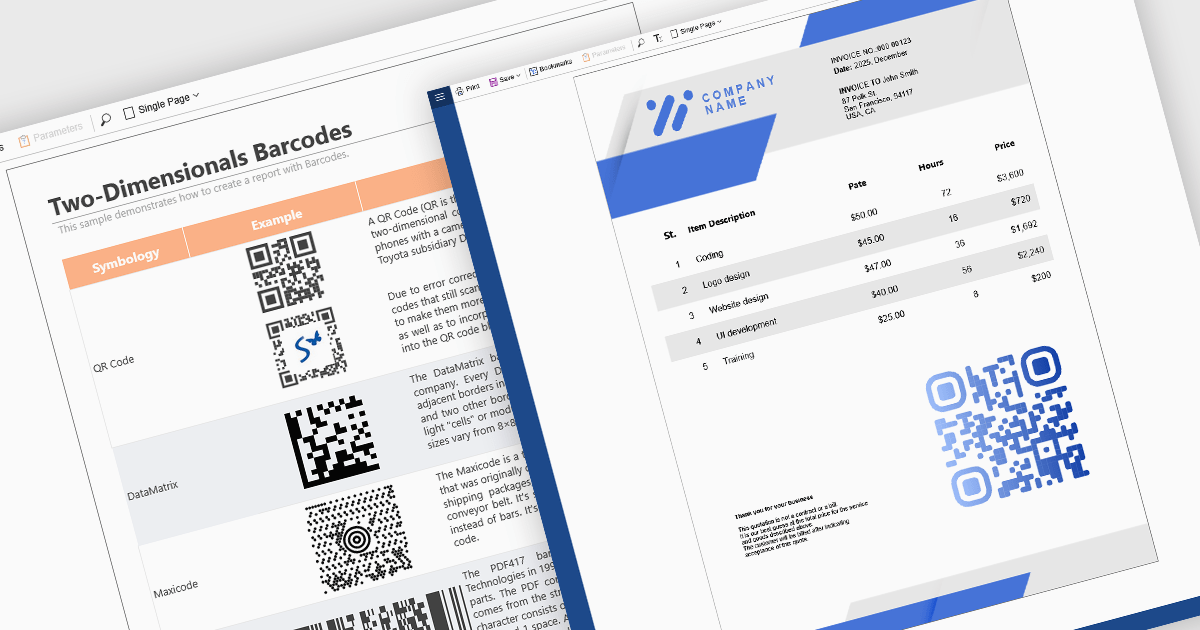
Barcode support in reporting components enables developers to embed machine-readable codes (barcodes, QR codes, DataMatrix, etc.) directly into reports. This feature is especially useful when printed or digital reports need to integrate with scanning systems, for example, in inventory management, shipping labels, product catalogs, or document tracking. By using a barcode component within a report template, reports can dynamically encode data fields (such as item IDs, order numbers, or URLs), ensuring that each generated report contains a barcode that corresponds to its data. This promotes automation, reduces manual errors, and improves interoperability with external scanning or inventory systems.
Several React reporting controls offer barcode support including:
For an in-depth analysis of features and price, visit our React reporting controls comparison.
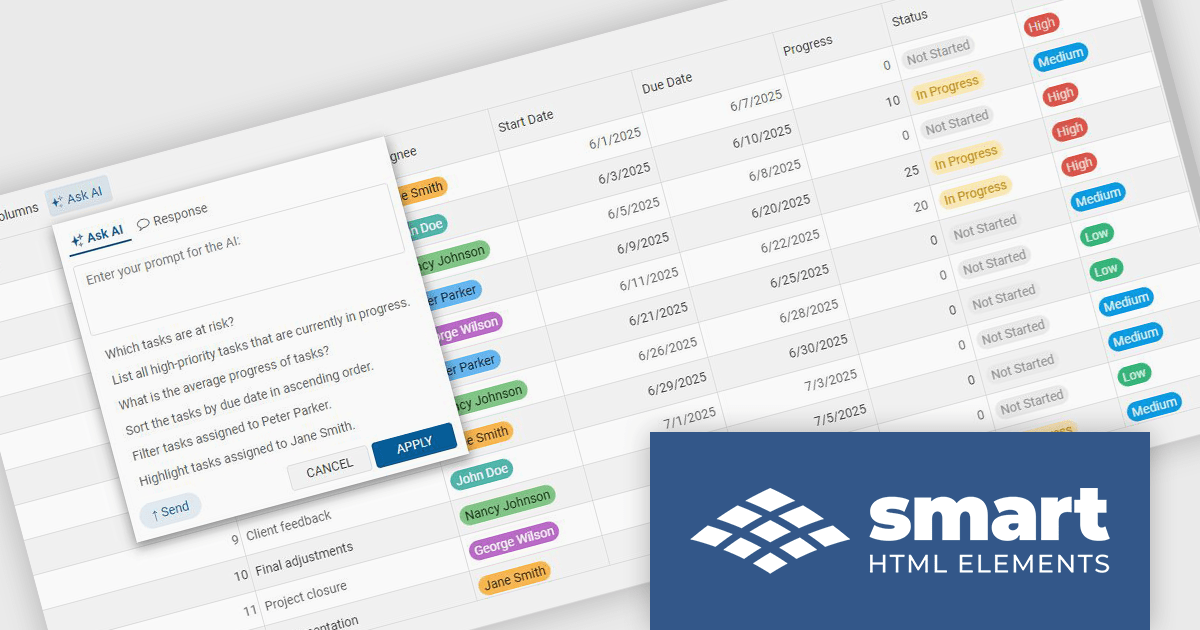
Smart UI by Smart HTML Elements is an enterprise-grade UI library offering pre-built web components for developers in Angular, React, Vue, Blazor, and JavaScript. It boasts over 60 ready-to-use components like grids, charts, schedulers, and editors, all featuring two-way data binding, responsiveness, accessibility, and theming capabilities. This library helps developers rapidly build dynamic and modern web applications with consistent look-and-feel and rich functionalities, accelerating development time and ensuring professional quality.
The Smart UI v25.0.0 release introduces a MCP Server that enables developers to generate production-ready UI components directly inside their editor using their preferred AI models. This feature improves implementation of complex elements such as grids, charts, and schedulers, reduces reliance on documentation, and maintains full control over data and privacy by allowing the use of personal API keys. It supports multiple leading AI providers, and integrates into existing processes, helping teams deliver consistent, high-quality interfaces more efficiently.
To see a full list of what's new in v25.0.0, see our release notes.
Smart UI (Smart HTML Elements) is licensed per developer and is available as a perpetual license with 1 year support and maintenance. It includes distribution to unlimited Web applications, SaaS projects, Intranets and Websites. Team, OEM and Enterprise licensing options are also available. See our Smart UI (Smart HTML Elements) licensing page for full details.
Learn more on our Smart UI (Smart HTML Elements) product page.
DevCraft by Telerik is a comprehensive AI-powered suite of more than 1,250 UI components and development tools designed for building modern web, desktop, and mobile applications using .NET and JavaScript frameworks. It includes reporting and report management solutions, automated testing and mocking tools, and document processing libraries, as well as a wide range of professionally designed user interface controls from the Telerik and Kendo UI suites. DevCraft enables developers to create feature-rich, high-performance applications with consistent design and user experience, delivering enterprise-level, scalable, and maintainable software solutions.
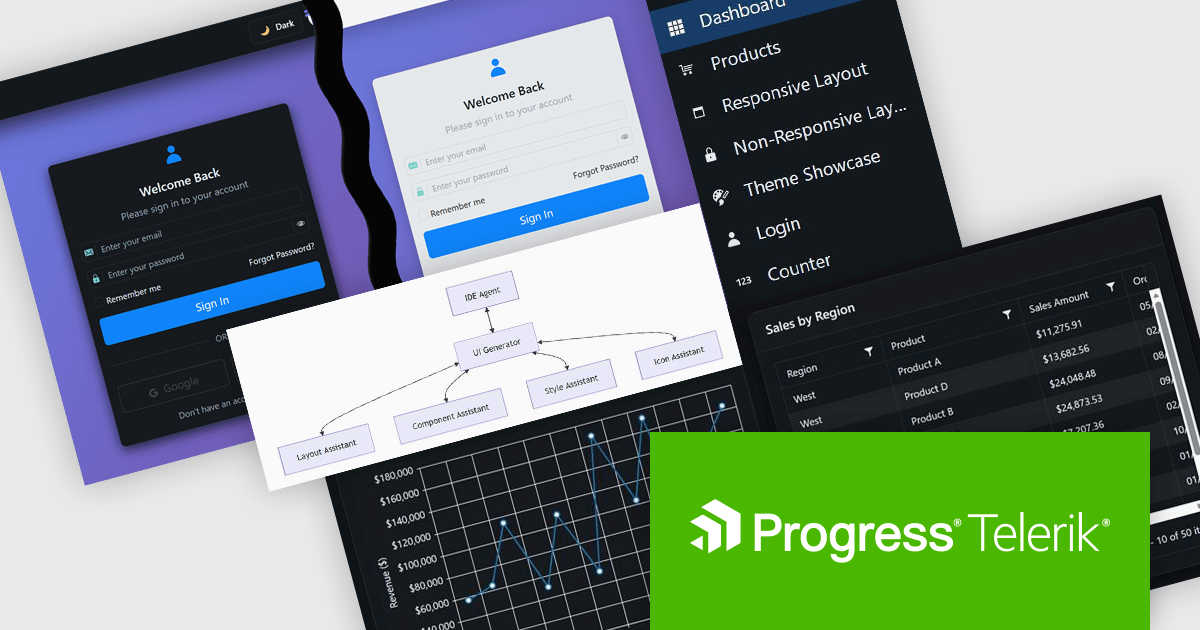
The Telerik DevCraft 2025 Q4 update adds the Agentic UI Generator which enables developers to translate natural language prompts directly into fully‑scaffolded, production‑ready user interfaces built on the Telerik and Kendo UI component libraries. It includes all the functionality of the AI Coding Assistant, as well as handling layouts, styling, responsive behavior, accessibility best‑practices, data‑bindings and theming from an MCP server that works in any AI-enabled IDE, so developers can remain in their familiar IDE and focus their effort on domain logic rather than boilerplate. This feature is only available as part of DevCraft Complete and DevCraft Ultimate subscription licenses and currently supports Blazor, Angular and React.
To see a full list of what's new in DevCraft 2025 Q4, see our release notes.
Telerik DevCraft is licensed per developer and has two licensing models: an annual Subscription License and a Perpetual License. The Subscription license provides access to the latest product updates, technical support, and exclusive benefits for a flat annual fee, and must be renewed to continue using the software. The Perpetual license is a one-time purchase granting access to the current released version and includes a one-year subscription for product updates and technical support. After this initial period, users can choose to renew the subscription element to continue receiving updates and support; otherwise, they may continue using the installed version available during their active subscription term but will forgo future updates and support. See our Telerik DevCraft Ultimate licensing page for full details.
For more information, see our product pages:
聯繫電話: (888) 850 9911
傳真: +1 770 250 6199


