


官方供應商
我們作為官方授權經銷商,直接提供超過200家開發廠家所發行超過1000個的產品授權給您。
請參閱我們所有的品牌。
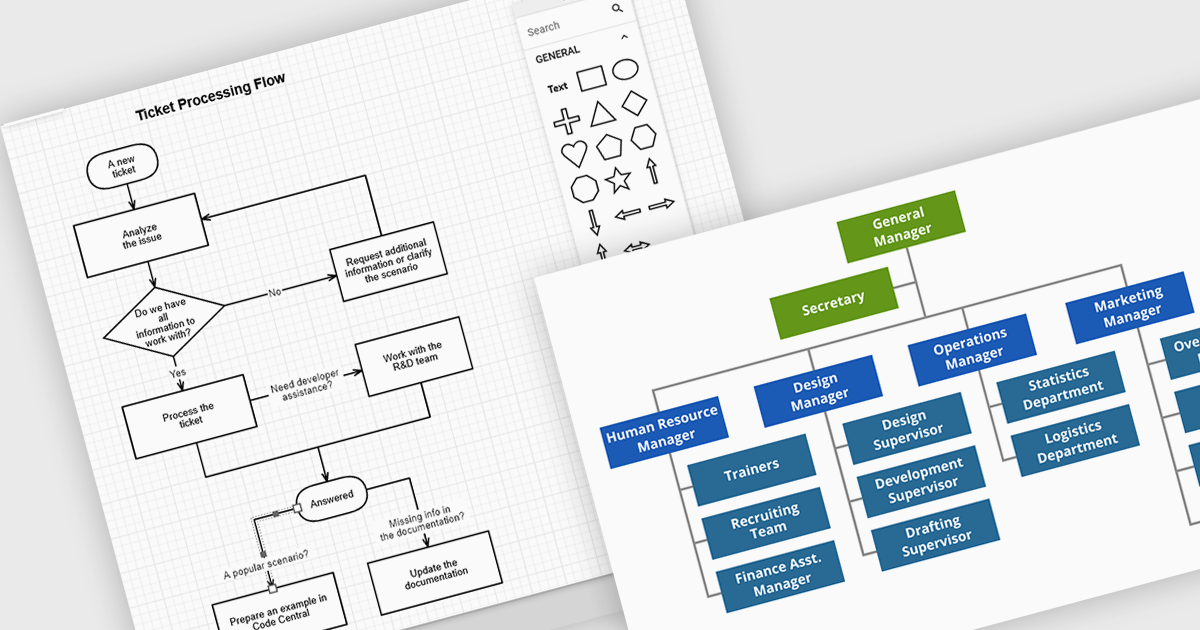
JavaScript diagramming components are libraries that enable developers to create interactive and dynamic diagrams in web applications. By offering customizable elements like nodes and connectors, they simplify the visualization of complex data, workflows, and processes. These components save development time and enhance user experience with pre-built tools for creating diagrams without the need for manual graphics handling. Common use cases include business process modeling, network architecture visualization, and organizational charts, making them ideal for applications requiring dynamic content and real-time collaboration.
Several JavaScript UI suites offer diagramming controls including:
For an in-depth analysis of features and price, visit our JavaScript UI suites comparison.
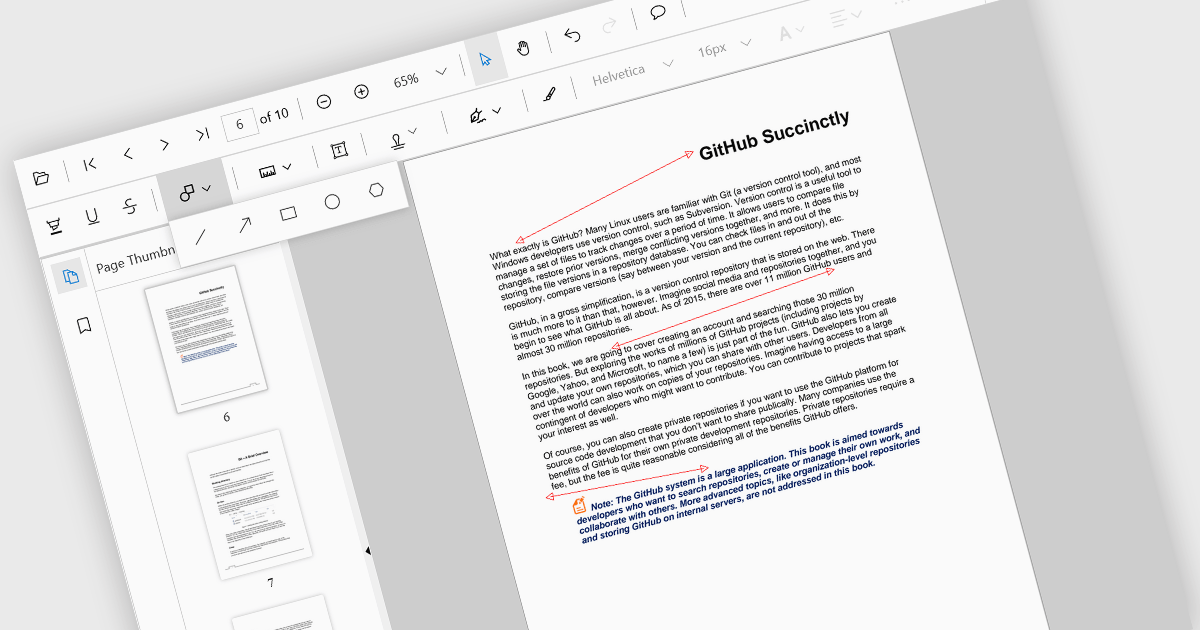
Arrow annotations are digital markings that allow users to visually indicate connections, relationships, or directions within a PDF document. They can be used to highlight specific sections, point out important details, or illustrate sequences of events. This feature is particularly valuable for collaborative work, as it enables multiple individuals to annotate the same document and share their insights effectively.
Several React PDF viewer controls offer support for arrow annotations including:
For an in-depth analysis of features and price, visit our React PDF viewer controls comparison.

Froala Editor is a JavaScript-based WYSIWYG HTML editor that empowers developers to seamlessly integrate rich text editing functionalities into their applications.
The Froala Editor 4.3 release offers a new "Transform" button in the image editing popup, allowing users to enhance images directly within the editor. This feature allows users to apply filters, resize images, and make various other adjustments with ease. Once changes are made, the image is instantly replaced with the transformed version. This integration streamlines the editing process, offering users greater control and flexibility over their visual content without needing to leave the editor.
To see a full list of what's new in 4.3, see our release notes.
Froala Editor is licensed per product and domain. It is available as an annual or perpetual license with version upgrades and support. See our Froala Editor licensing page for full details.
For more information, visit our Froala Editor product page.
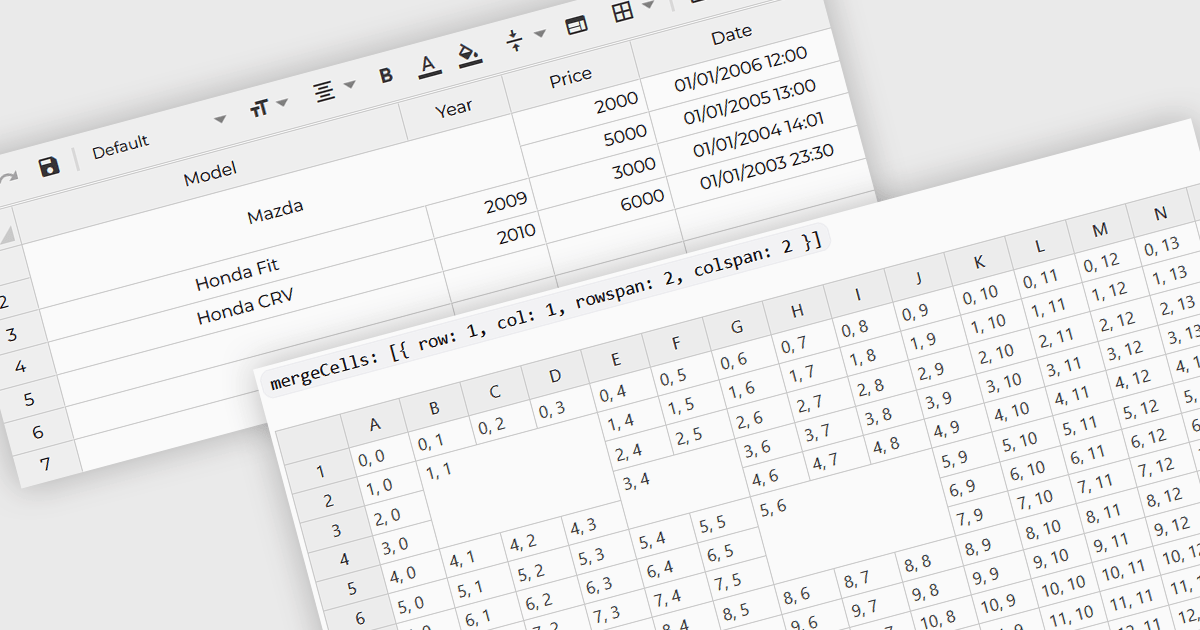
Cell merging refers to a grid component's ability to combine adjacent cells, either horizontally or vertically, to create a single unified cell. This is often used to display related data more efficiently by avoiding redundancy and improving the visual organization of complex datasets. For software developers, the benefit of cell merging lies in enhancing readability and clarity when representing hierarchical or grouped information. By merging cells, developers can present data in a more structured way, reducing clutter and allowing users to focus on key information without the distraction of repeated values.
Several Angular grid controls offer support for merging cells including:
For an in-depth analysis of features and price, visit our Angular grid controls comparison.
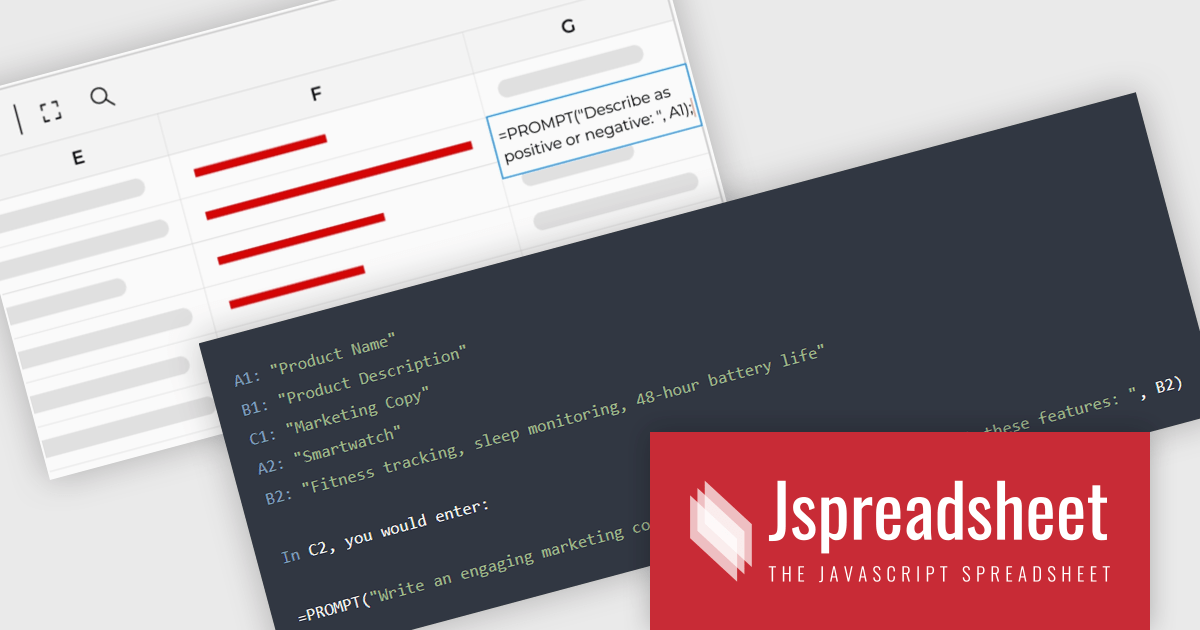
Jspreadsheet Pro is a flexible JavaScript-based spreadsheet solution that enables developers to create customizable, feature-rich data grids for web applications. It offers advanced formulas, data validation, and API integrations. Ideal for tasks like financial modeling, inventory management, and project tracking, it helps businesses efficiently manage and analyze data. Its backend server integration supports real-time data processing, enhancing workflows and boosting productivity across various industries.
Jspreadsheet Pro seamlessly incorporates ChatGPT API into data grids. This integration facilitates automated content generation, efficient response management, and comprehensive data analysis. For full functionality it requires the Jspreadsheet Server extension which enables front-end queries to communicate with the API via your back-end, delivering real-time data and insights to users.
Jspreadsheet Pro is licensed as an Annual or a Perpetual License with support and maintenance. We can supply any Jspreadsheet Pro license including new licenses, maintenance renewals, and upgrade licenses. See our Jspreadsheet Pro for full details.
For more information, visit our Jspreadsheet Pro product page.
聯繫電話: (888) 850 9911
傳真: +1 770 250 6199


