


官方供應商
我們作為官方授權經銷商,直接提供超過200家開發廠家所發行超過1000個的產品授權給您。
請參閱我們所有的品牌。
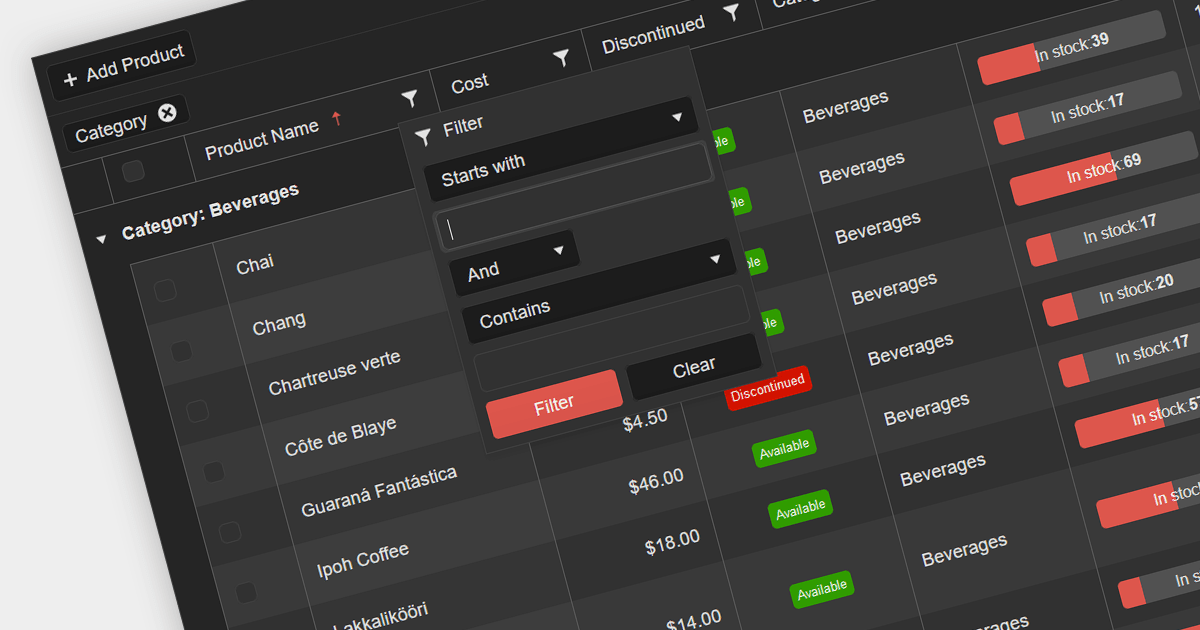
Grid filters allow users to narrow down data displayed in a tabular format based on specific criteria. They enhance data exploration, simplify data analysis, and improve user experience by presenting only relevant information. Users can apply filters to columns, enabling them to find information more efficiently, making it a valuable feature for building interactive, data-driven Web applications.
Several .NET 7 Blazor grid controls offer filtering support including:
Alternatively, many grid controls are available as part of multi-function suites:
For an in-depth analysis of features and price, visit our comparison of .NET 7 Blazor grids.
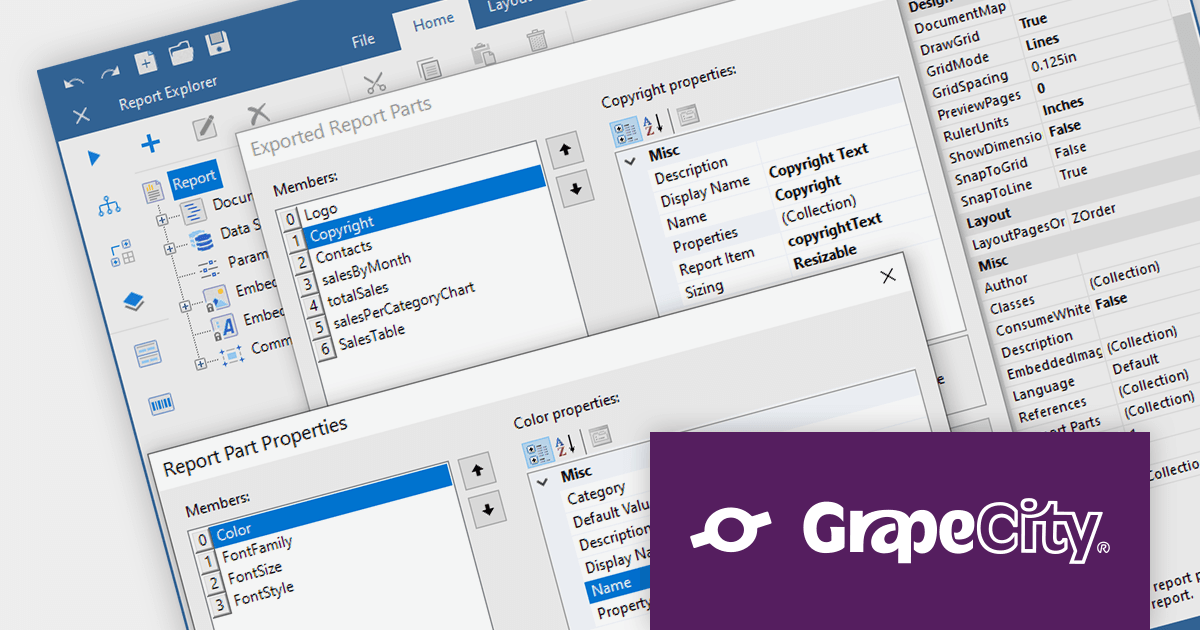
ActiveReports.NET is a reporting tool that allows developers to design and deliver reports with intuitive, reliable, and user-friendly report designers and controls. Features include the ability to create reports in a variety of formats, such as PDF, Excel, and HTML. ActiveReports.NET is also highly customizable, with an extensive API and advanced feature library.
ActiveReports.NET v17.2 introduces Report Parts, which can be created from any report item, including tables, charts, text boxes, and images. These Report Parts are created by developers and added to the ActiveReports toolbox for end-users to drag and drop onto the design surface. This makes it easy for end-users to create complex reports without having to learn the intricacies of report design. Developers can specify the properties of the Report Part, such as its data binding, formatting, and visibility so that they that are tailored to the specific needs of their users.
To see a full list of what's new in version 17.2, see our release notes.
For more information, visit our ActiveReports.NET product page.
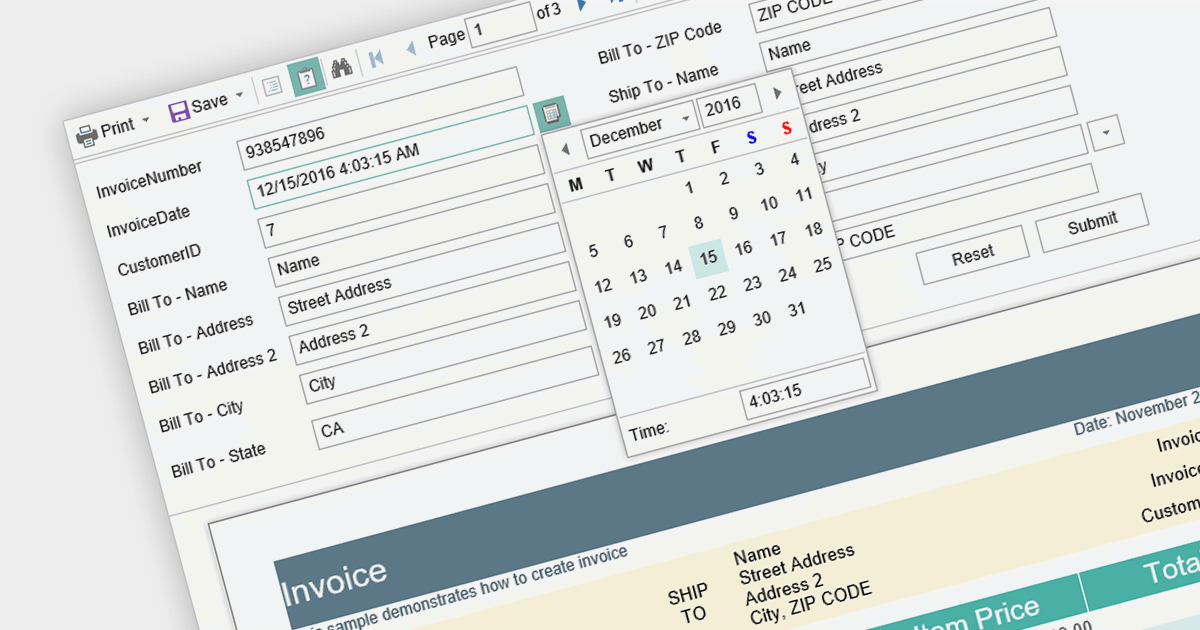
Report parameters are dynamic values that users can input or select when requesting a report. These parameters allow users to customize the report's content, appearance, and data filtering according to their specific needs. This helps to make reports more versatile, catering to various scenarios without requiring developers to create separate report templates.
Here is a selection of Blazor reporting controls that include support for parameters:
For an in-depth analysis of features and price, visit our comparison of Blazor reporting controls.
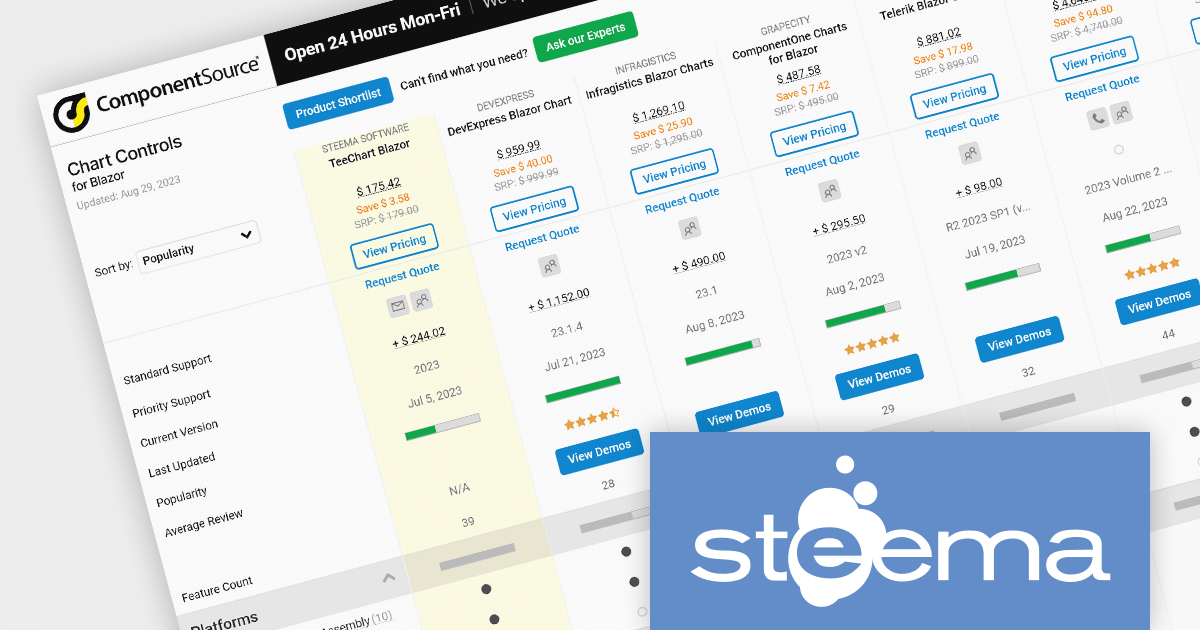
As the premier marketplace for software components and development tools, we are pleased to announce the addition of TeeChart .NET for Blazor by Steema Software to our Blazor Charts Comparison. This latest inclusion further enriches the comparison, providing developers with a broader choice of high-performance charting components for their Blazor projects.
TeeChart .NET for Blazor is a charting library that allows you to create interactive charts in Blazor applications. It supports a wide variety of chart types, including line charts, bar charts, pie charts, and more. You can also customize the look and feel of your charts to match your application's branding.
TeeChart for Blazor can be used with Framework 4 and NET5/NET6, and the Blazor Chart component can be used in both WASM and Blazor Server projects. It also allows you to use TeeChart's ES6 JavaScript library exclusively as Razor Library Components.
Our updated Blazor Charts Comparison enables developers to evaluate TeeChart with 10 other popular Blazor charting components. It provides a thorough analysis of each control's features, including supported chart types, data binding options, interactivity and styling, as well as pricing and community reviews. With extensive sorting and filtering options, our comparison makes it easy to shortlist products and find the best solutions for your needs.
By incorporating TeeChart .NET for Blazor into the comparison, we continue to ensure that developers have access to a comprehensive overview of the top charting components available in the growing Blazor component market. This empowers developers to make informed decisions based on their specific requirements, saving time and effort in the selection process.
For an in-depth analysis of features and price, visit our comparison of Blazor charts.
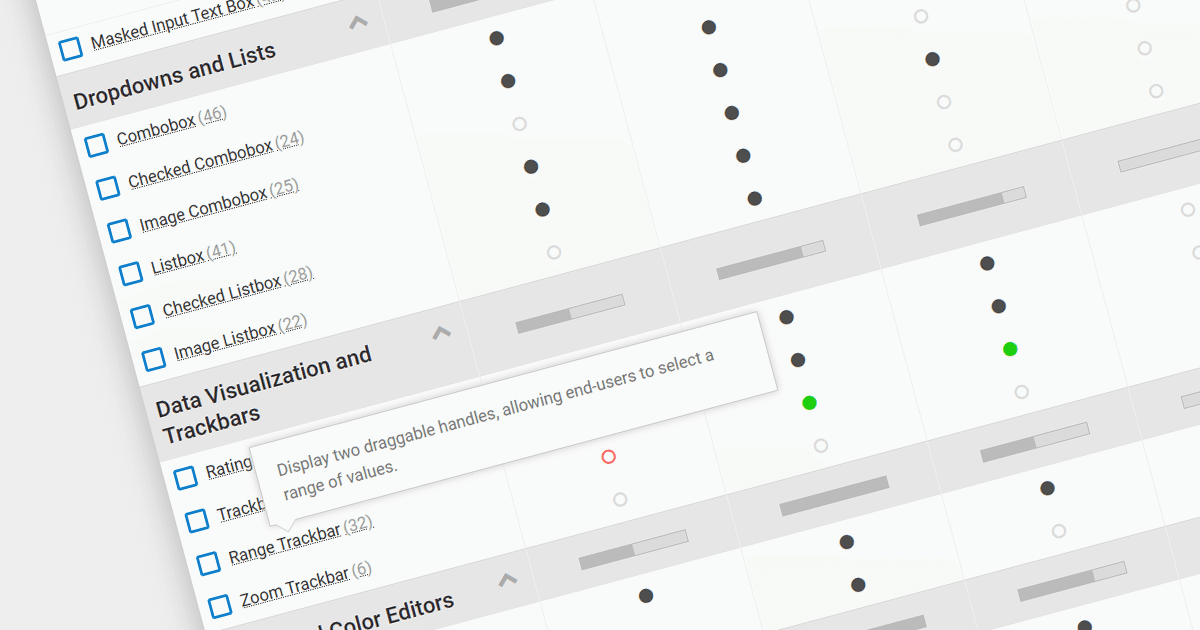
We are pleased to announce our new .NET Data Editors Comparison. This innovative tool allows developers to efficiently compare data editor controls from multiple software publishers to find the best solution for their .NET projects.
Choosing the right data editor collection can be challenging, given the wide range of options available. Our comparison tool simplifies the decision-making process by providing a side-by-side comparison of popular data editors, highlighting their key features, performance, and compatibility with .NET platforms. The tool also offers an intuitive interface that allows developers to sort and filter by feature, compatibility, price, and average review.
Compare .NET data editor collections from leading brands including:
For an in-depth analysis of features and price, visit our comparison of .NET data editors.
聯繫電話: (888) 850 9911
傳真: +1 770 250 6199


