


官方供應商
我們作為官方授權經銷商,直接提供超過200家開發廠家所發行超過1000個的產品授權給您。
請參閱我們所有的品牌。
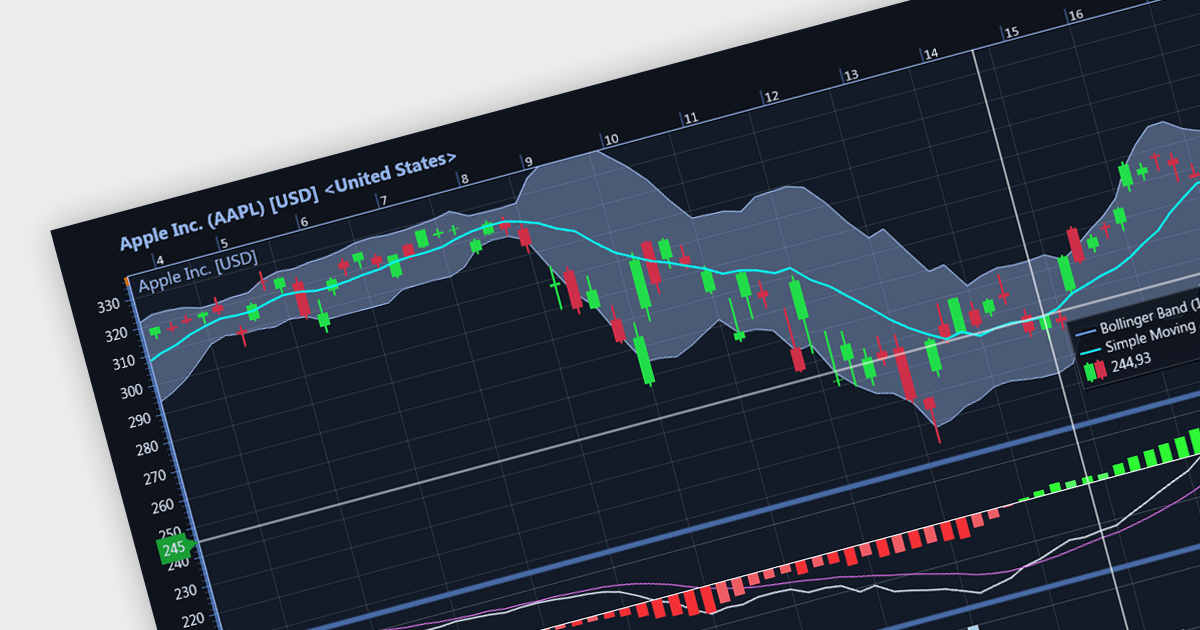
Candlestick charts are a style of financial chart used to describe price movements of a security, derivative, or currency. Each "candlestick" typically shows one day, with the central "box" representing the range between the opening and closing prices and the lines showing highs and lows. Their unique visual format helps traders to quickly understand market sentiment.
Several WinForms chart controls offer Candlestick charts including:
For an in-depth analysis of features and price, visit our WinForms chart controls comparison.
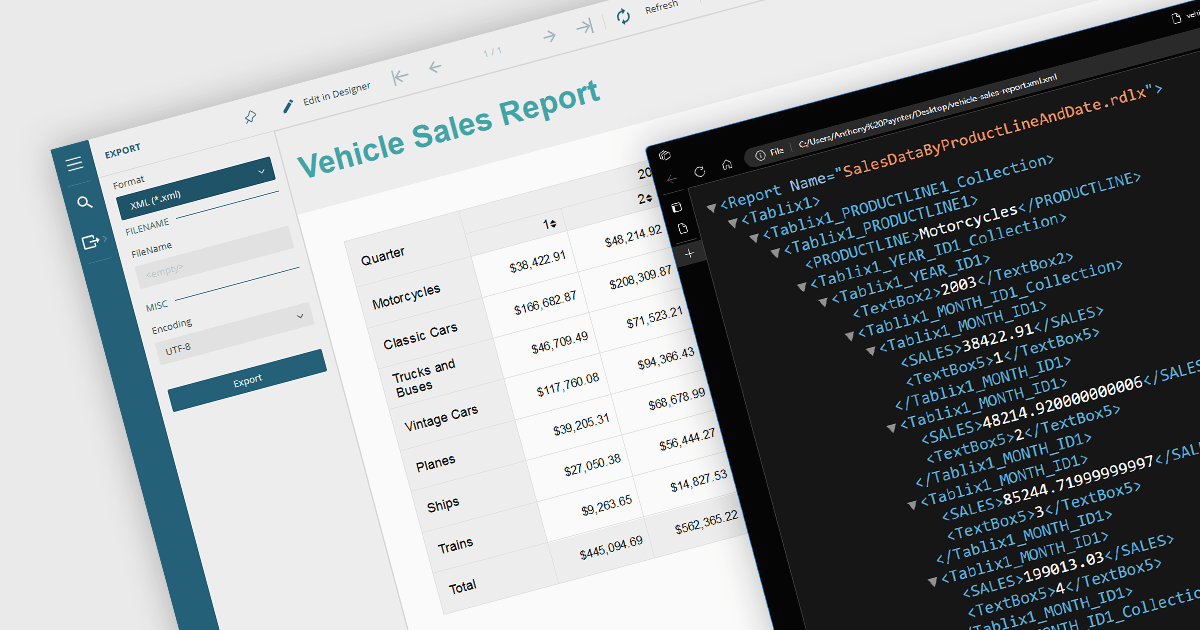
Exporting reports to XML offers several benefits. Firstly, its structured format makes it easy to share and integrate with various applications and platforms regardless of their operating system or software. This flexibility fosters seamless data exchange and analysis across different systems. Secondly, XML's clear tags and hierarchy simplify data manipulation and transformation, allowing for easier filtering, sorting, and restructuring of report data. Additionally, XML's compact nature often translates to smaller file sizes, making it efficient for storage and transmission. Overall, XML export empowers users with greater flexibility, interoperability, and data manipulation compared to traditional formats, unlocking valuable insights from their reports.
Several .NET WinForms reporting controls offer XML export including:
For an in-depth analysis of features and price, visit our .NET WinForms reporting comparison.
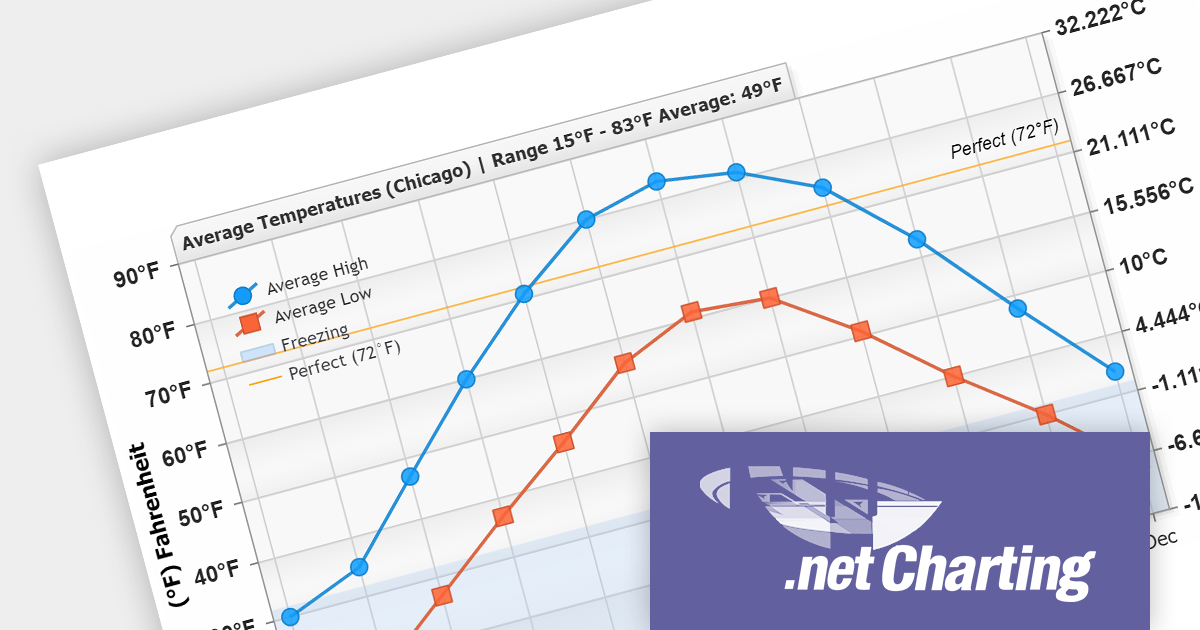
.netCHARTING provides a managed charting solution for C# and VB.NET developers working with ASP.NET or WinForms. It combines visually stunning graphics and a comprehensive interface that help add compelling charts to your apps. This high performance charting control also contains a feature rich data access and aggregation system with calculation support.
The .netCHARTING V10.6 release adds support for .NET 8. This allows developers to enjoy the performance boosts, enhanced cross-platform compatibility, and new APIs in the latest version of Microsoft's popular development framework.
.netCHARTING is licensed per site (1 web site on 1 sever), per server (unlimited web sites on 1 server) or per developer (single application) and is available as a Perpetual License with a 12 month subscription which includes major and minor upgrades and priority email support. See our .netCHARTING licensing page for full details.
For more information, visit our .netCHARTING product page.
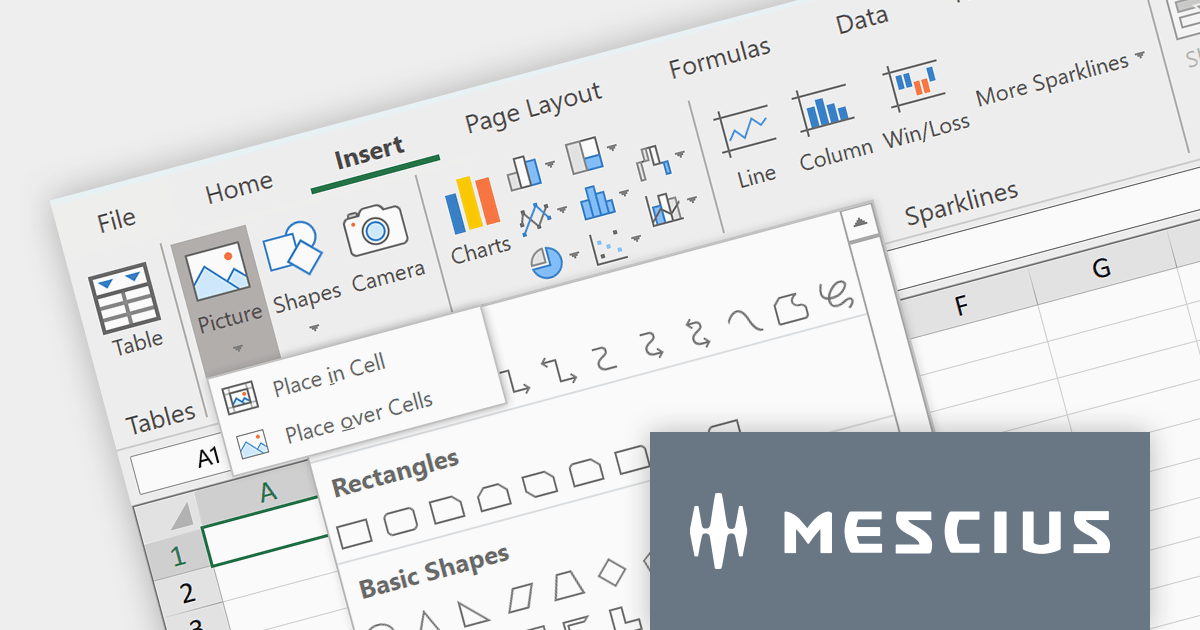
Spread.NET by MESCIUS is a powerful tool for building Excel-like applications in your .NET projects. It lets you create interactive spreadsheets, grids, dashboards, and even forms within WinForms, ASP.NET, and WPF applications. With its rich feature set, including a robust calculation engine, formula support, and Excel compatibility, Spread.NET empowers developers to build data analysis tools, budgeting apps, scientific dashboards, and more, all within the familiar .NET environment.
The Spread.NET v17 release adds a new Ribbon control to modernize your spreadsheet's look and feel. Inspired by Excel, this intuitive interface organizes commands into clear, contextual tabs and groups, making it easy for users to find the tools they need. This modern upgrade not only boosts productivity but also brings a familiar feel to your spreadsheets, streamlining the entire user experience.
To see a full list of what's new in version 17, see our release notes.
Spread.NET is licensed per developer and is available as a Perpetual License with a 12 month support and maintenance subscription. We can supply any Spread.NET license including new licenses, maintenance renewals, and upgrade licenses. See our Spread.NET licensing page for full details.
For more information, visit our Spread.NET product page.
DevExpress Reporting is a powerful, versatile tool for building reports in the .NET ecosystem. It lets you design professional-looking reports with a visual editor, connect to various data sources, and customize them with charts, graphs, and interactive elements. Whether you're creating invoices, sales summaries, or complex dashboards, DevExpress Reporting offers the flexibility and features to bring your data to life in a clear and insightful way. It integrates seamlessly with WinForms, WPF, Web, and Blazor applications, making it a popular choice for developers who need a robust reporting solution.
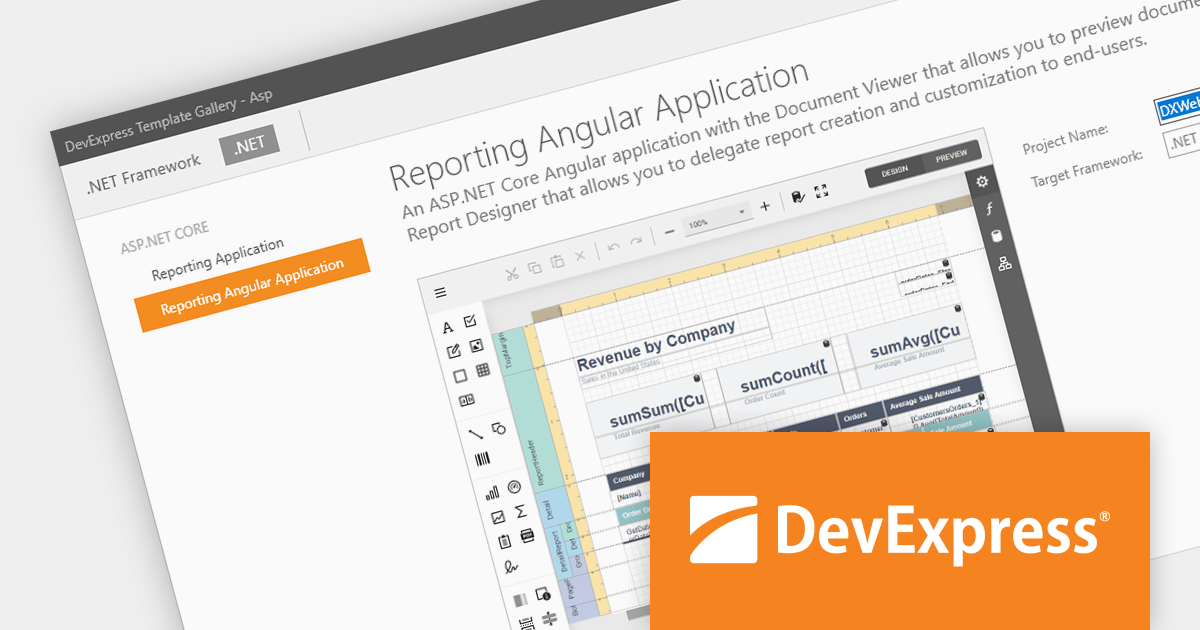
The DevExpress Reporting 23.2 release introduces a native Angular Report Viewer. This new component seamlessly integrates into your Angular applications, eliminating the need for Knockout.js. Built for performance, it leverages native platform rendering for lightning-fast document visualization. Property management is simplified, replacing observable complexities with a straightforward event-based mechanism. To optimize development, you can now utilize native Angular components as templates for report viewer elements. Embrace a streamlined, efficient, and Knockout-free reporting experience with the Native Angular Report Viewer.
To see a full list of what's new in version 23.2, see our release notes.
DevExpress Reporting is licensed per developer and is available as a Perpetual License with a 12 month support and maintenance subscription. See our DevExpress Reporting licensing page for full details.
DevExpress Reporting is available to buy in the following products:
聯繫電話: (888) 850 9911
傳真: +1 770 250 6199


