


官方供應商
我們作為官方授權經銷商,直接提供超過200家開發廠家所發行超過1000個的產品授權給您。
請參閱我們所有的品牌。
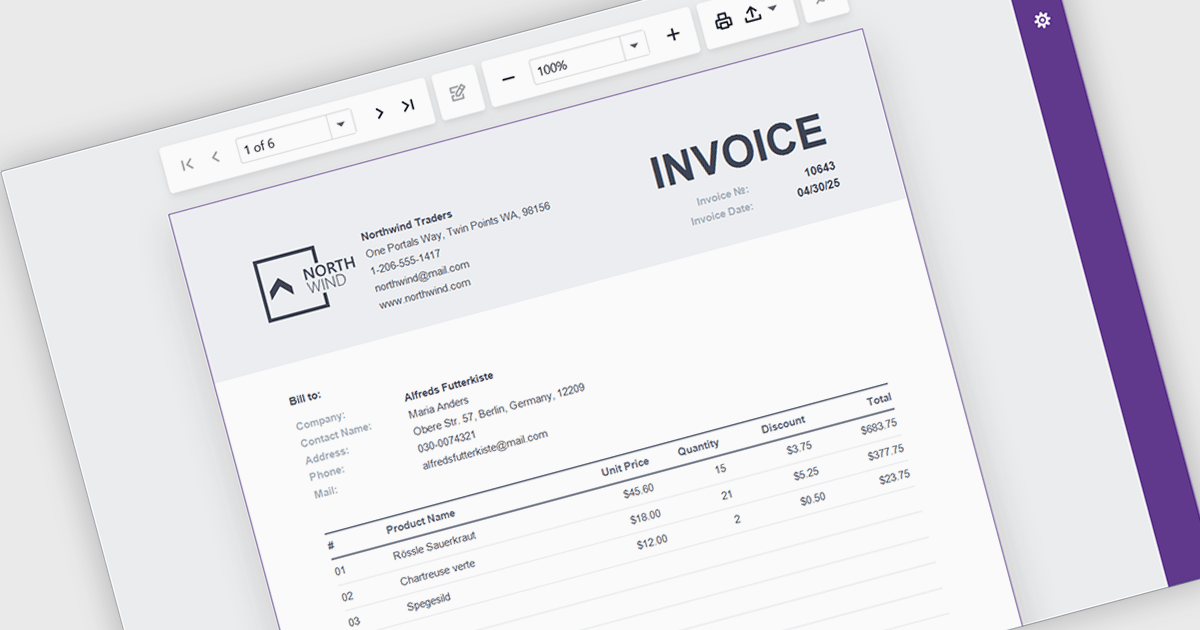
A report viewer is a UI element that renders and displays pre-built reports within a Blazor web application, allowing users to interact with them through features like pagination, parameter input, search, and export. It serves as the front-end interface for consuming reports generated by a reporting engine, often backed by data from databases or APIs. For developers, it enables seamless integration of reporting capabilities into Blazor applications without requiring page reloads or external viewers, supports responsive design for various devices, and maintains a consistent user experience through Blazor's component-based architecture.
Several Blazor Reporting Controls offer support for a report viewer including:
For an in-depth analysis of features and price, visit our comparison of Blazor Reporting Controls.
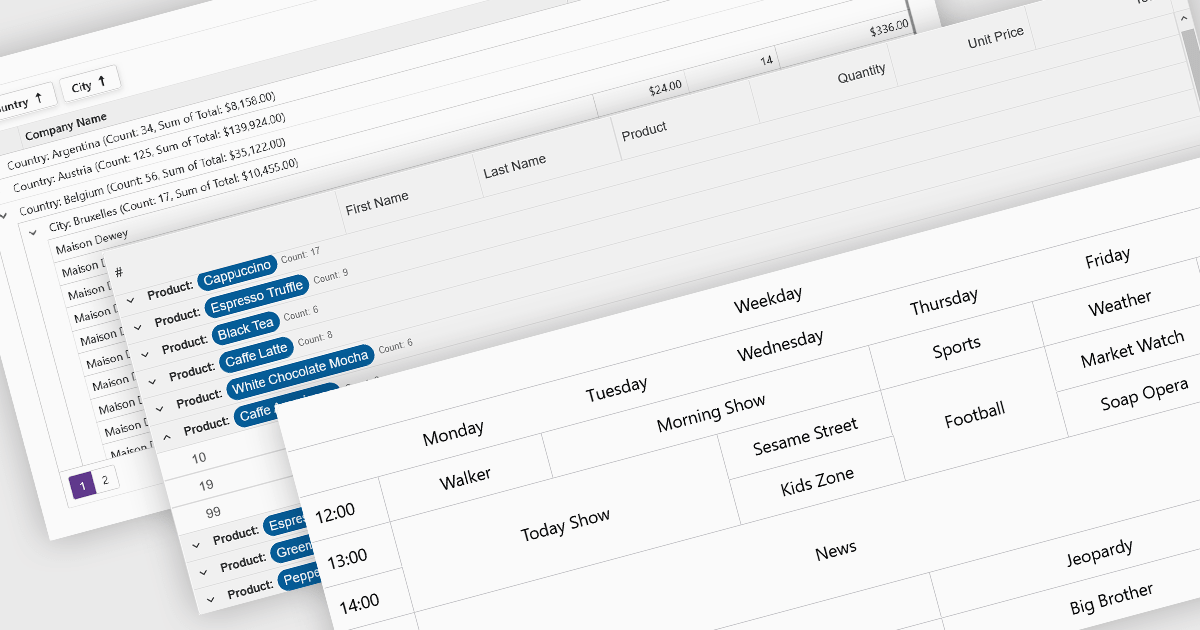
Data visualization and analysis features in grid components transform raw tabular data into structured, interpretable formats that support faster insights and decision-making. These features go beyond static display, offering dynamic ways to organize, summarize, and explore data directly within the grid interface, making it a powerful tool for both end-users and analysts.
Common features include:
For an in-depth analysis of features and price, visit our Blazor grid components comparison.
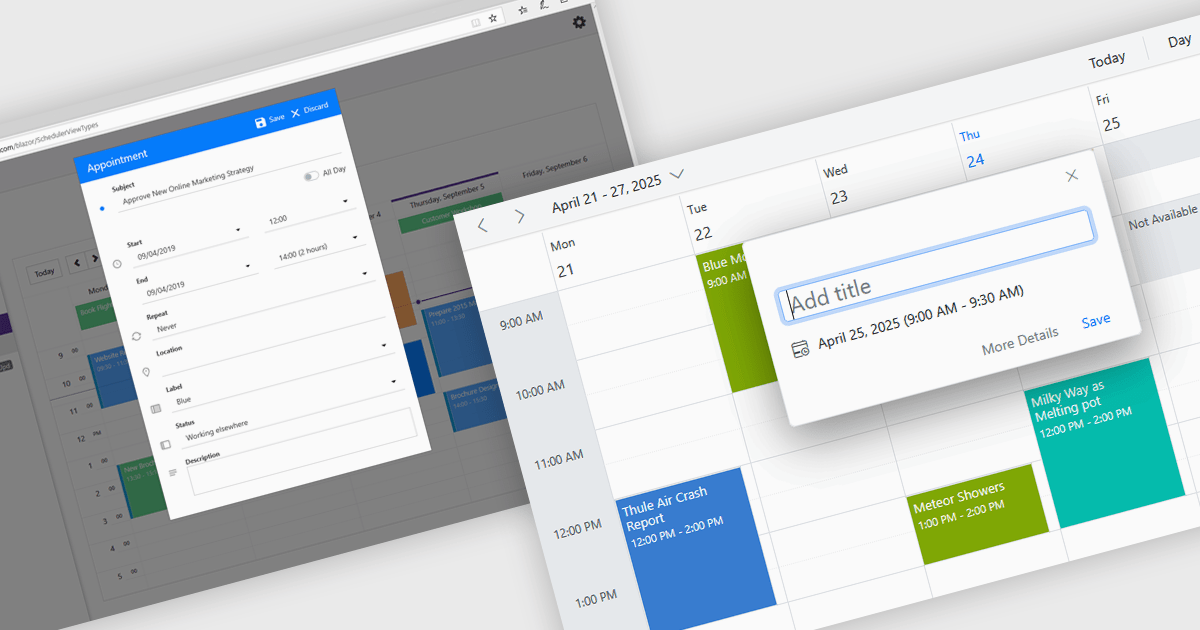
Scheduling controls offer an intuitive interface for efficient task, appointment, and resource management. Real-time updates, automated scheduling, and conflict detection ensure seamless team and workflow coordination. Users can personalize views, preferences, and recurring events, enhancing productivity and user experience. Integrated with backend systems and APIs, these tools support dynamic data, making them ideal for workforce management, appointment booking, and project planning in industries such as healthcare, finance, and customer service.
Several .NET Blazor User Interface suites offer scheduling controls including:
For an in-depth analysis of features and price, visit our .NET Blazor UI suites comparison.
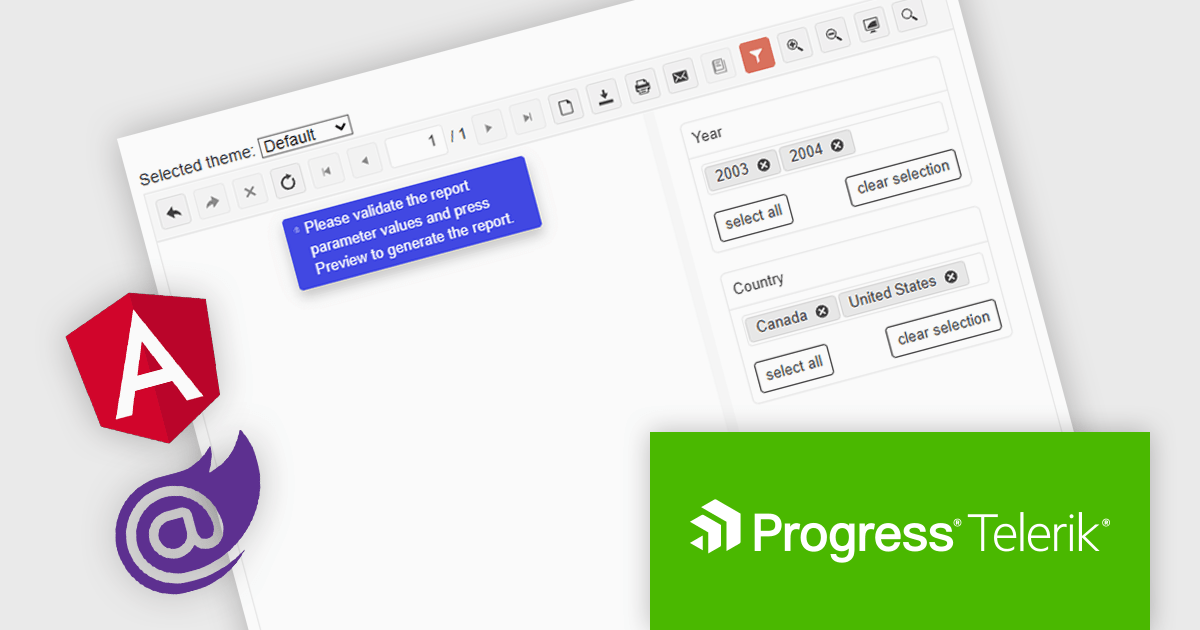
Telerik Reporting is a comprehensive and lightweight embedded reporting tool for .NET web and desktop applications. It enables developers and reporting users to create, design, and export visually appealing, interactive, and reusable reports to effectively present analytical and business data. It supports various technologies, including ASP.NET Core, Blazor, ASP.NET MVC, ASP.NET AJAX, HTML5/JS, Angular, WPF, WinForms, and WinUI.
The Telerik Reporting 2025 Q1 update introduces user-initiated initial report preview in the native Blazor and Angular viewers, giving developers greater control over how and when reports are rendered. Instead of automatically generating reports on viewer load, this feature allows end users to manually trigger the preview process. This improvement helps reduce unnecessary data processing and improves application performance, particularly in scenarios involving large datasets or complex report logic. It also supports more efficient resource management on both the client and server sides, enabling developers to create faster, more responsive, and user-friendly reporting experiences.
To see a full list of what's new in 2025 Q1 (19.0.25.211), see our release notes.
Telerik Reporting is licensed per developer and has two licensing models: an annual Subscription License and a Perpetual License. The Subscription license provides access to the latest product updates, technical support, and exclusive benefits for a flat annual fee, and must be renewed to continue using the software. The Perpetual license is a one-time purchase granting access to the current released version and includes a one-year subscription for product updates and technical support. After this initial period, users can choose to renew the subscription element to continue receiving updates and support; otherwise, they may continue using the installed version available during their active subscription term but will forgo future updates and support. See our Telerik Reporting licensing page for full details.
Telerik Reporting is available to buy in the following products:
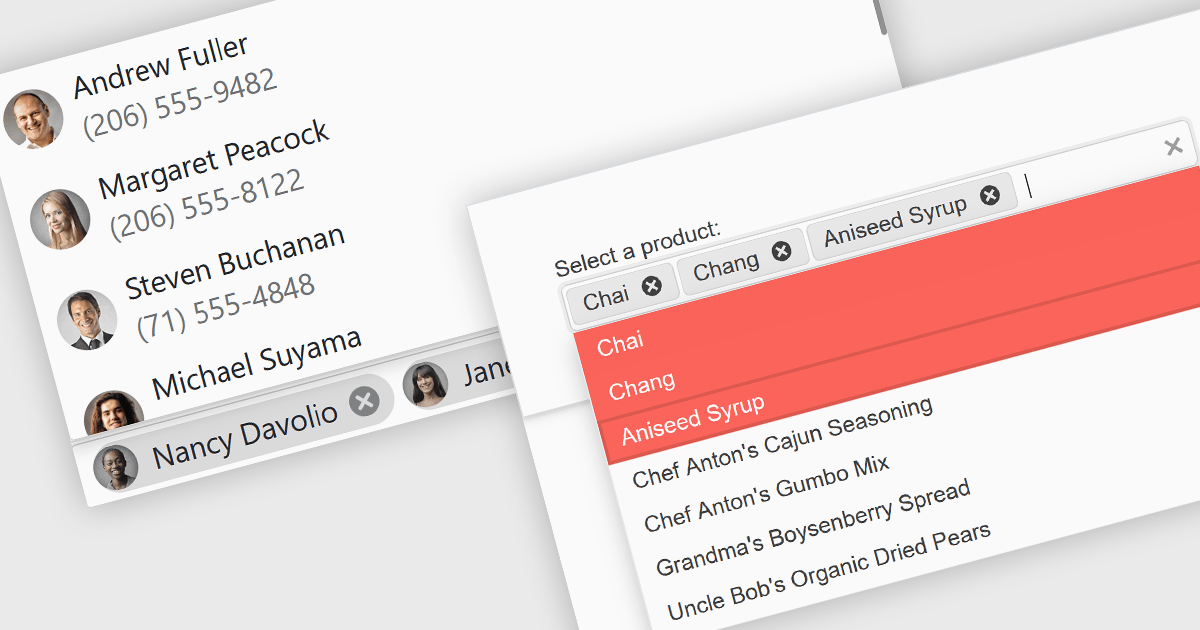
Token or tag boxes provide a user-friendly interface for selecting multiple items from a list. These controls present each selected item as a visually distinct "tag" or "token" within the input area, allowing for quick recognition and easy removal. Ideal for scenarios like multi-category selection or user input of discrete values such as emails or keywords, token boxes enhance both the user experience and data clarity, particularly in web applications that require dynamic form entry or filtering.
Several Blazor Data Editors offer support for token boxes including:
For an in-depth analysis of features and price, visit our Blazor data editors comparison.
聯繫電話: (888) 850 9911
傳真: +1 770 250 6199


