


官方供應商
我們作為官方授權經銷商,直接提供超過200家開發廠家所發行超過1000個的產品授權給您。
請參閱我們所有的品牌。
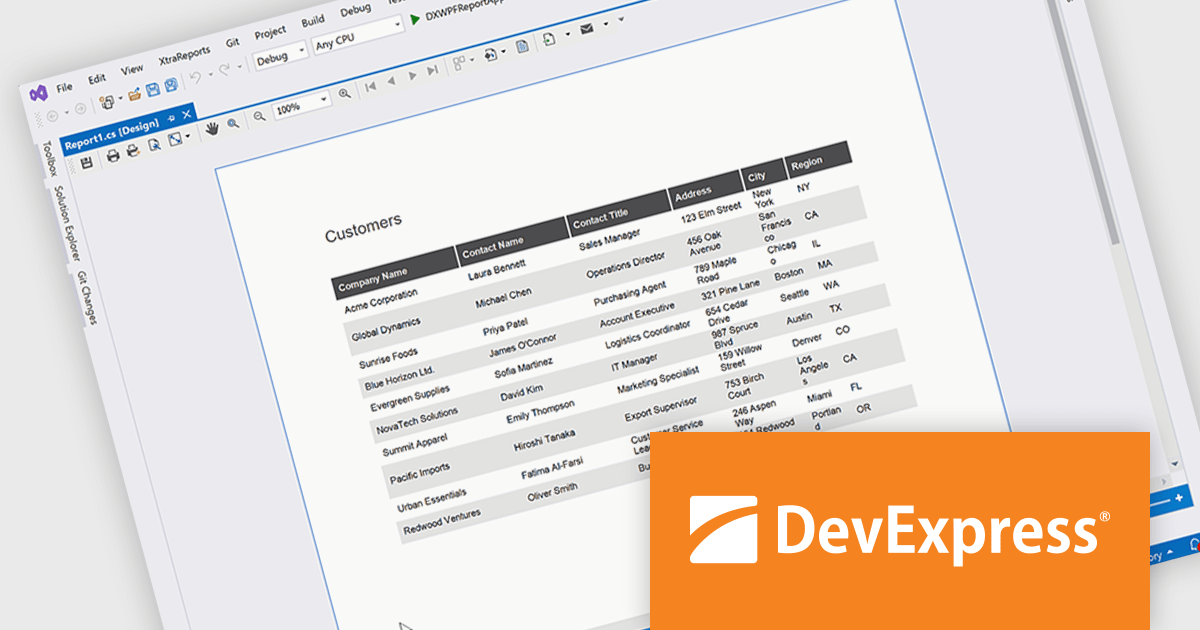
DevExpress Reporting is a comprehensive suite of reporting tools that empowers developers to create visually stunning and highly customizable reports for various applications. With its rich feature set, including data binding, layout design, printing, and exporting capabilities, DevExpress Reporting enables the efficient creation of reports that meet the most demanding business requirements.
The DevExpress Reporting 25.2 update allows developers to generate AI-generated test data to preview reports directly within the Visual Studio and End-User Report Designers for WinForms and WPF. By removing the need to connect to a live data source during design, it supports faster iteration and easier layout validation. This is particularly valuable when production data is unavailable or when sharing report templates that must not include sensitive information.
To see a full list of what's new in version 25.2, see our release notes.
DevExpress Reporting is licensed per developer and is available as a Perpetual License with a 12 month support and maintenance subscription. See our DevExpress Reporting licensing page for full details.
DevExpress Reporting is available to buy in the following products:
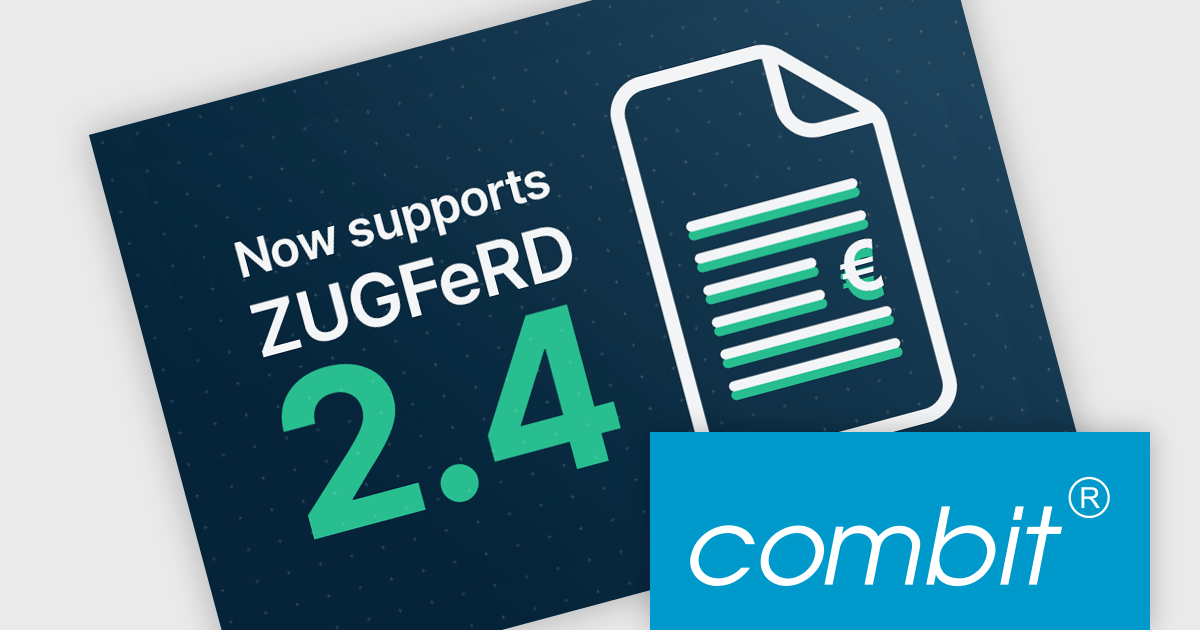
List & Label by combit is a software development toolkit that helps developers to integrate comprehensive reporting functionalities into their desktop, web, and cloud applications. It offers features such as data binding, complex data visualization, and a user-friendly report designer, along with printing, exporting, and previewing capabilities. List & Label operates independently of programming languages and data sources, providing developers with the flexibility to design and deliver informative reports within their development environment.
The List & Label 31.001 update adds support for ZUGFeRD 2.4, enabling standards-compliant electronic invoices to be generated as part of existing reporting and document output processes. Developers can produce invoices that combine a conventional PDF layout with embedded XML data compatible with EN 16931, allowing the same document to be used for both visual review and automated processing. This allows current e-invoicing requirements to be met without introducing separate invoice formats or additional export logic.
To see a full list of what's new in version 31.001, see our release notes.
List & Label is licensed per developer and is available as a Perpetual License with a 12 month support and maintenance subscription. See our List & Label licensing page for full details.
List & Label is available in the following products:
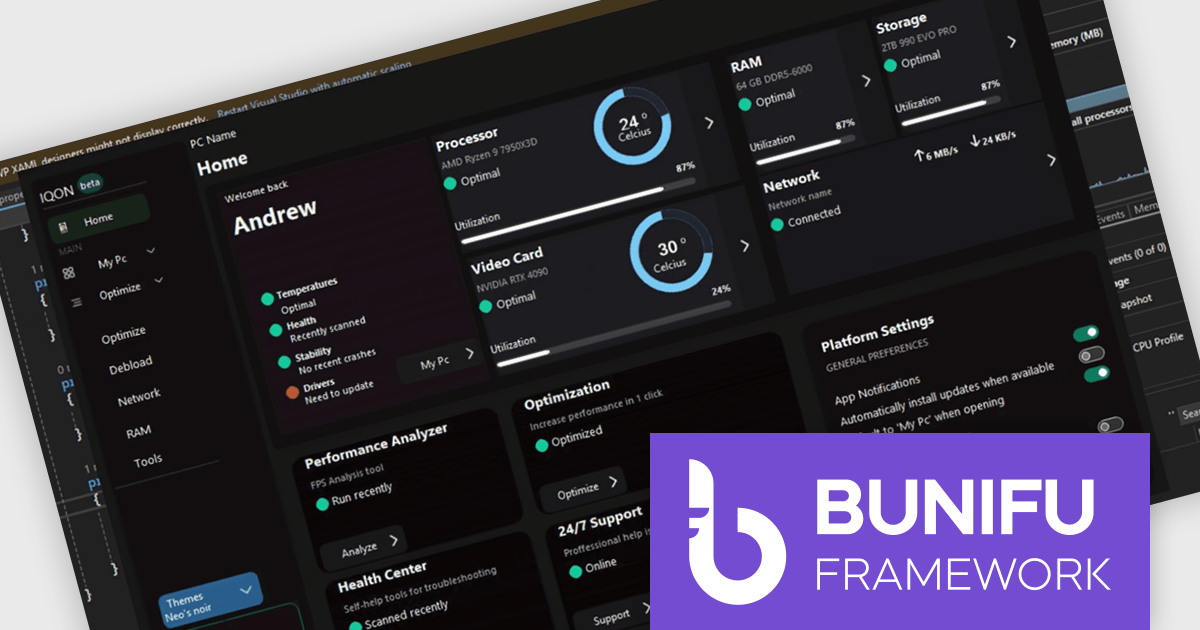
Bunifu UI WinForms is a user interface (UI) framework designed to improve the development of modern and visually appealing desktop applications using Microsoft's WinForms platform. It provides a wide array of pre-built, customizable UI components, such as charts, a data grid, gradient panel, and slider, that emphasize a minimalist aesthetic while maintaining performance efficiency. With it developers can significantly enhance the UI development process, allowing them to drag-and-drop elements and leverage extensive design properties to create professional-looking applications in less time.
Designing a system performance monitor UI using Bunifu UI WinForms allows software developers to create modern, visually clear, and responsive monitoring interfaces while continuing to work within the familiar WinForms framework. The framework provides ready-made, highly customizable controls and smooth interaction behaviors that simplify building professional dashboards for real-time system metrics, reduce reliance on custom UI rendering and styling code.
Bunifu UI WinForms is licensed per developer and are available in four plans, three of which are annual licenses while the other is perpetual. All plans come with free version updates and Premium support for the active license period. See our Bunifu UI WinForms licensing page for full details.
Bunifu UI WinForms is available in the following products:
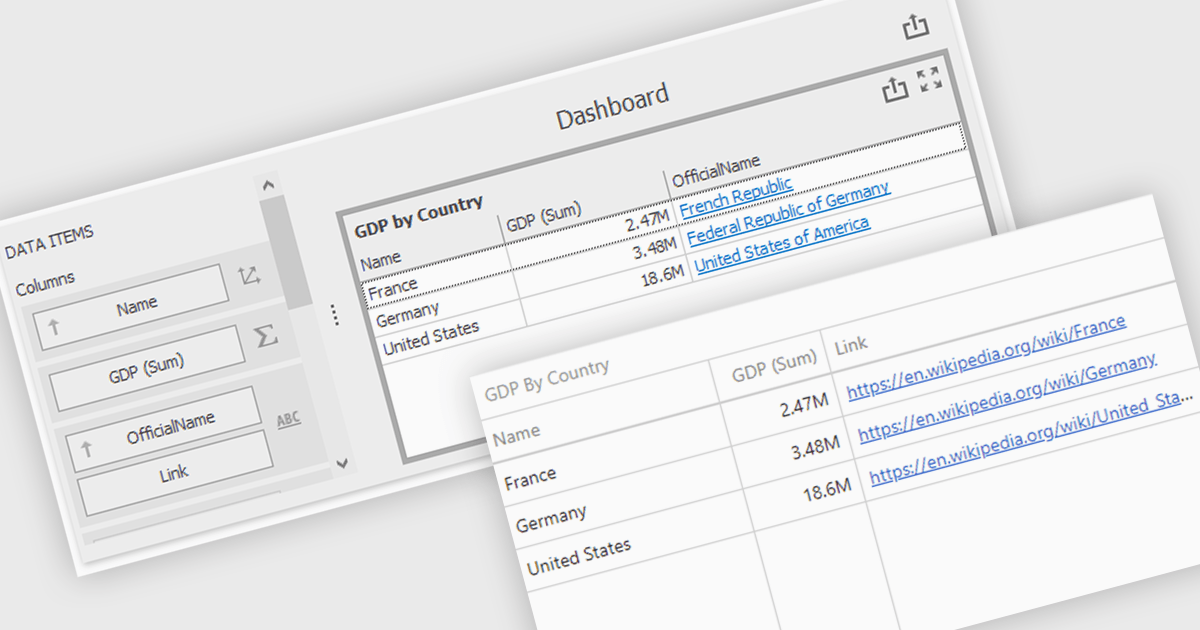
Hyperlinks in grid cells allow data within a grid to be presented as clickable links, enabling users to navigate directly to related pages, records, or actions from a single view. This reduces the need for extra navigation steps, and makes relationships between data clearer and more intuitive. Key benefits include faster access to detailed information and a more interactive user experience. Common use cases include linking order numbers to order details, customer names to profile pages, or grid entries to related documents, reports, or edit screens.
Several .NET WinForms grid controls offer hyperlink cell types, including:
For an in-depth analysis of features and price, visit our .NET WinForms grid controls comparison.
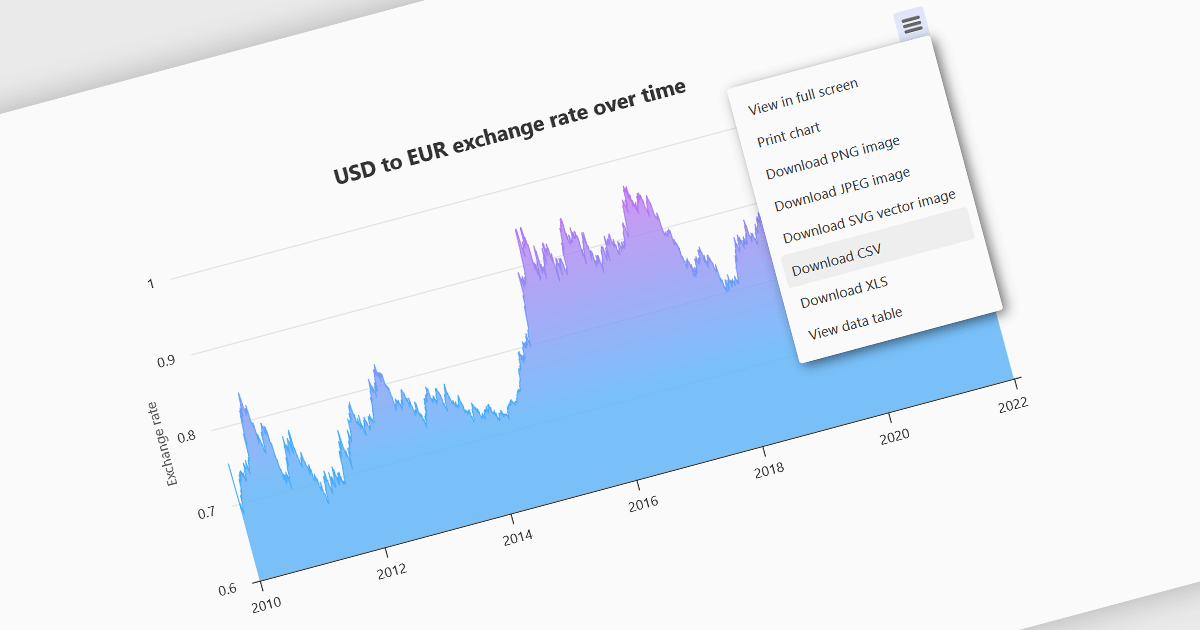
Exporting charts to CSV (Comma-Separated Values) allows users to extract underlying chart data into a simple, portable text format that can be easily opened in spreadsheet applications or processed by other tools. This feature is particularly useful for reporting, data analysis, auditing, and integration apps, as it decouples the visual presentation of data from the raw numerical or categorical information it represents. By enabling quick access to chart data in a structured format, exporting to CSV enhances interoperability across systems and supports a wider range of use cases.
Several WinForms charting components allow you to export to CSV, including:
For an in-depth analysis of features and price, visit our comparison of WinForms chart components.
聯繫電話: (888) 850 9911
傳真: +1 770 250 6199


