


官方供應商
我們作為官方授權經銷商,直接提供超過200家開發廠家所發行超過1000個的產品授權給您。
請參閱我們所有的品牌。
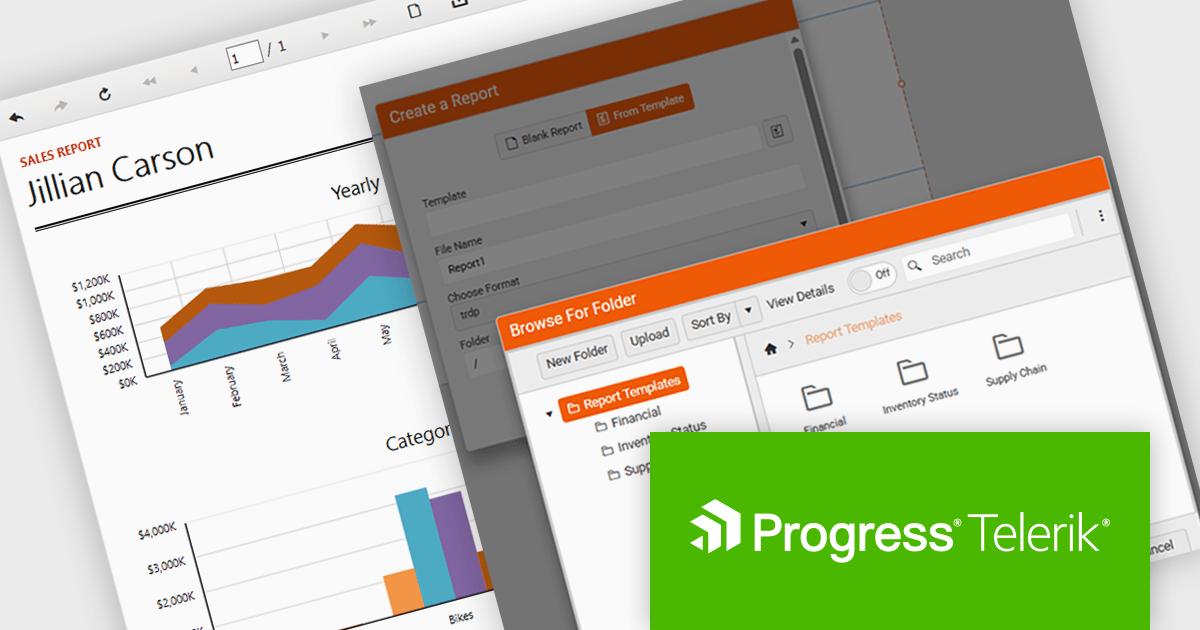
Telerik Reporting is a comprehensive and lightweight embedded reporting tool for .NET web and desktop applications. It enables developers and reporting users to create, design, and export visually appealing, interactive, and reusable reports to effectively present analytical and business data. It supports various technologies, including ASP.NET Core, Blazor, ASP.NET MVC, ASP.NET AJAX, HTML5/JS, Angular, WPF, WinForms, and WinUI.
The Telerik Reporting 2025 Q4 update introduces customizable report templates in the Web Report Designer, giving developers a faster and more controlled way to produce consistent, production-ready reports. By allowing teams to define, save and reuse templates that include predefined layout structures, styling rules and data components, the feature reduces repetitive setup work, maintains uniform design standards across projects and ensures every new report begins with a reliable, compliant foundation.
To see a full list of what's new in 2025 Q4 (19.3.25.1111), see our release notes.
Telerik Reporting is licensed per developer and is available as a perpetual license with a one year support subscription, which is offered in three tiers: Lite, Priority or Ultimate. See our Telerik Reporting licensing page for full details.
Telerik Reporting is available to buy in the following products:
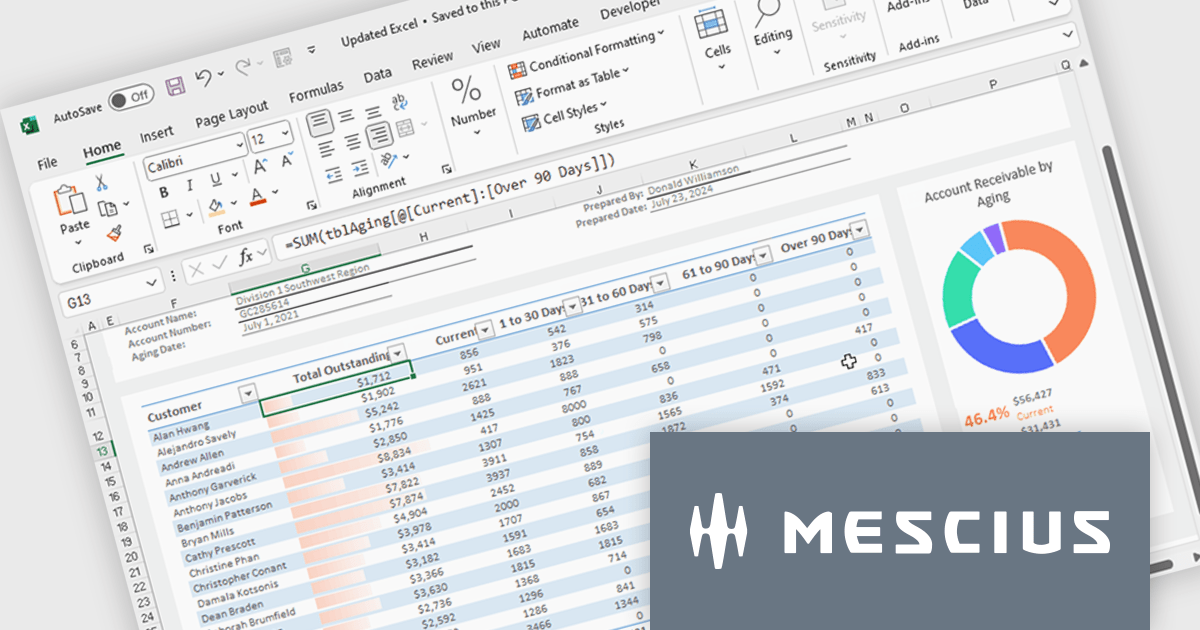
Spread.NET helps you create spreadsheets, grids, dashboards, and forms. It includes a powerful calculation engine with 450+ functions and the ability to import and export Excel spreadsheets. You can develop in Visual Studio using VB or C# for WinForms, ASP.NET, and WPF.
In this blog post, MESCIUS Product Marketing Specialist Mackenzie Albitz guides you through four essential steps for importing and exporting Excel spreadsheets in your WPF applications:
Detailed sample code is included and you can even download a finished sample project to follow along.
Read the complete blog post to learn the steps for integrating this powerful Excel functionality into your WPF applications.
Spread.NET is licensed per developer and is available as a Perpetual License with a 12 month support and maintenance subscription. We can supply any Spread.NET license including new licenses, maintenance renewals, and upgrade licenses. See our Spread.NET licensing page for full details.
For more information, visit our Spread.NET product page.
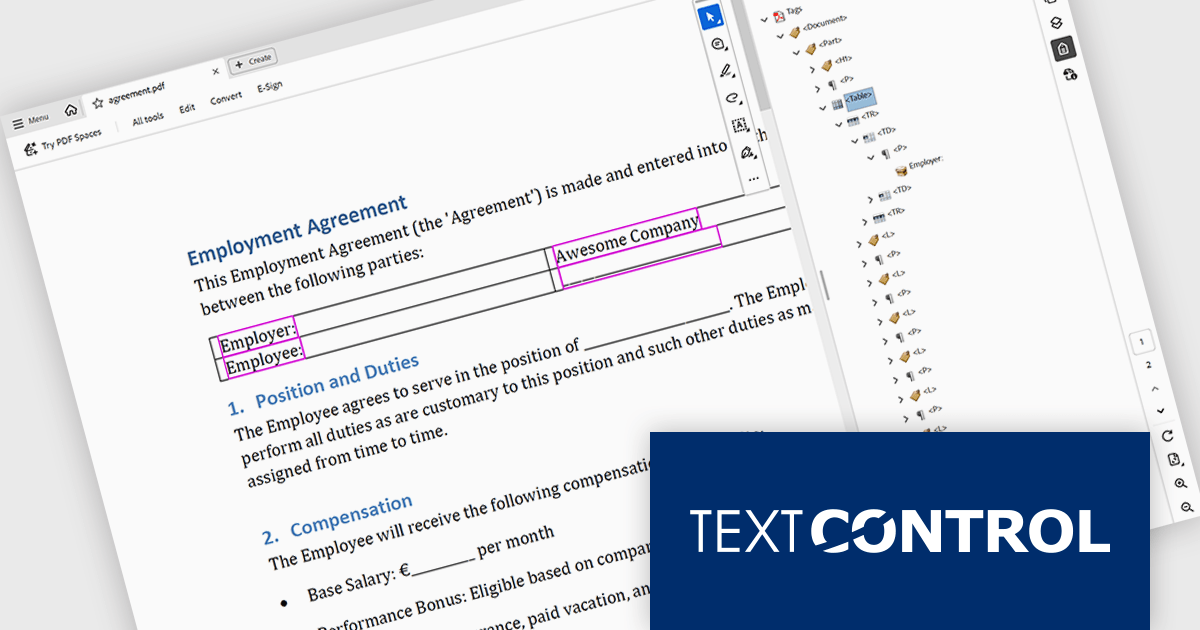
TX Text Control .NET is a royalty-free, fully programmable document editor that empowers developers to add rich WYSIWYG word processing to desktop and web applications across various platforms. It provides everything from comprehensive text formatting and mail merge to PDF creation and processing, all through a robust API and intuitive user interface.
The TX Text Control .NET 34.0 Enterprise now supports the PDF/UA (Universal Accessibility) standard, enabling developers to generate PDF documents that comply with ISO 14289-1 accessibility guidelines. This update ensures that documents are properly structured and tagged for assistive technologies like screen readers, helping organizations meet legal and regulatory requirements for accessible digital content. With this enhancement, TX Text Control makes it easier to deliver inclusive, compliant PDFs across industries where accessibility is essential, such as government, healthcare, and education.
To see a full list of what's new in version 34.0, see our release notes.
TX Text Control .NET for Windows Forms and TX Text Control .NET for WPF are licensed per developer and are available as a Perpetual License with a 12 month support and maintenance subscription. See our TX Text Control .NET for Windows Forms licensing page or TX Text Control .NET for WPF licensing page for full details.
TX Text Control .NET is available to buy in the following products:
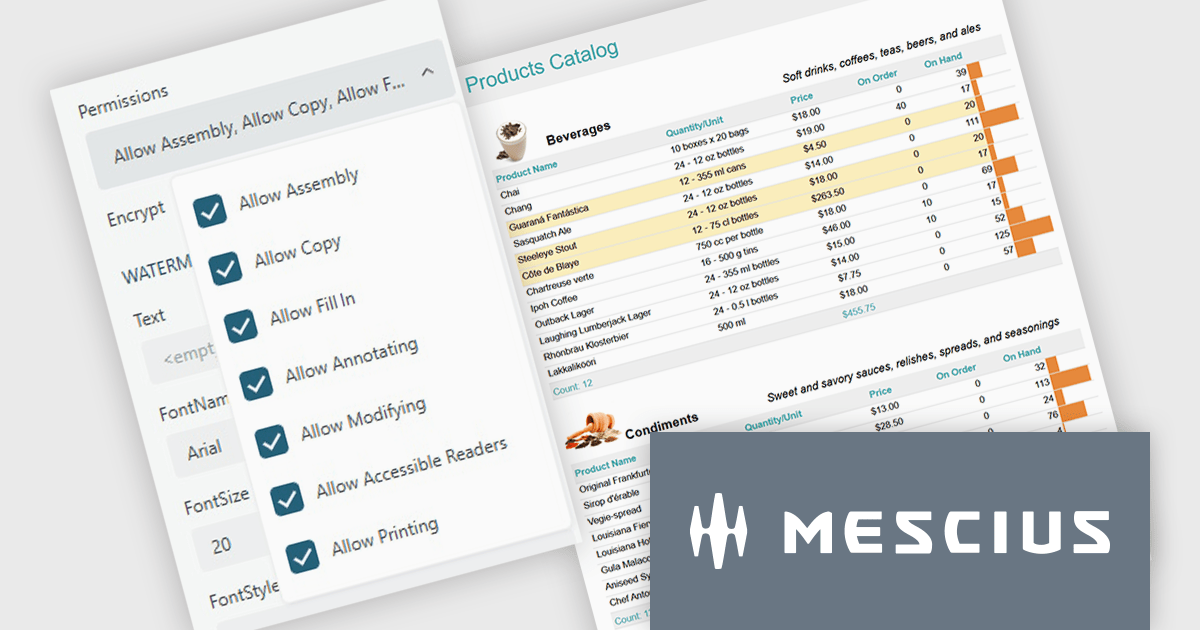
ActiveReports.NET from MESCIUS, is a comprehensive reporting solution for developers building applications in .NET. It helps you to design and deliver visually appealing reports through user-friendly designers and a wide range of controls. ActiveReports simplifies report creation and distribution with a versatile API, rich data source connectivity, and support for multiple export formats. This translates to increased developer productivity and improved end-user experience with powerful reporting functionalities within your .NET applications.
The ActiveReports.NET v19.2 update introduces configurable permissions for PDFs exported from Web Viewers, allowing developers to apply precise controls over how end users interact with generated documents. By enabling encryption and selecting permissions such as copying, printing, annotating, modifying, filling forms, and accessing content through assistive readers, developers can enforce security, compliance, and workflow requirements directly within the export process. This update optimizes permission management across the JS Viewer, Blazor Viewer, and ASP.NET WebViewer, providing a consistent and efficient way to govern document behavior without additional code or external tooling.
To see a full list of what's new in v19.2, see our release notes.
ActiveReports.NET is licensed per developer and is available with or without a 12 month support and maintenance subscription. See our ActiveReports.NET licensing page for full details.
Learn more on our ActiveReports.NET product page.
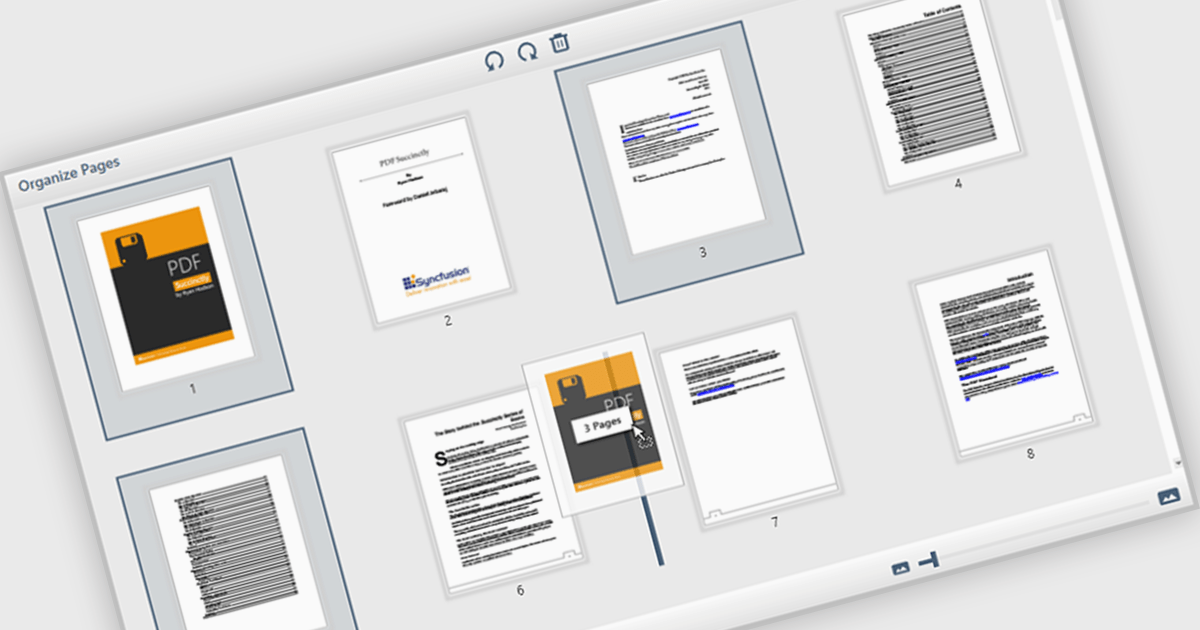
The ability to move and arrange pages in a PDF viewer allows users to reorder individual pages within a PDF document directly through the interface. For software developers, this feature supports more dynamic document processes, especially in applications involving content assembly, form management, or automated report generation. It reduces the need for external tools or manual editing, which simplifies integration and enhances user experience when managing complex or multi-page documents.
Several WPF (Windows Presentation Foundation) PDF viewer components allow you to move and arrange pages in a PDF, including:
For an in-depth analysis of features and price, visit our WPF PDF viewer comparison.
聯繫電話: (888) 850 9911
傳真: +1 770 250 6199


