


官方供應商
我們作為官方授權經銷商,直接提供超過200家開發廠家所發行超過1000個的產品授權給您。
請參閱我們所有的品牌。
Syncfusion Essential Studio Blazor (available as part of Syncfusion Essential Studio Enterprise) is a comprehensive UI component library designed to accelerate the development of high-performance, modern web applications using the Blazor framework. It boasts over 85+ responsive, lightweight, and modular components spanning various categories such as data visualization, data editing, document processing, and interactive UI elements. This rich repertoire empowers developers to rapidly build user-friendly, feature-rich web interfaces, with seamless integration of both server-side and client-side Blazor applications.
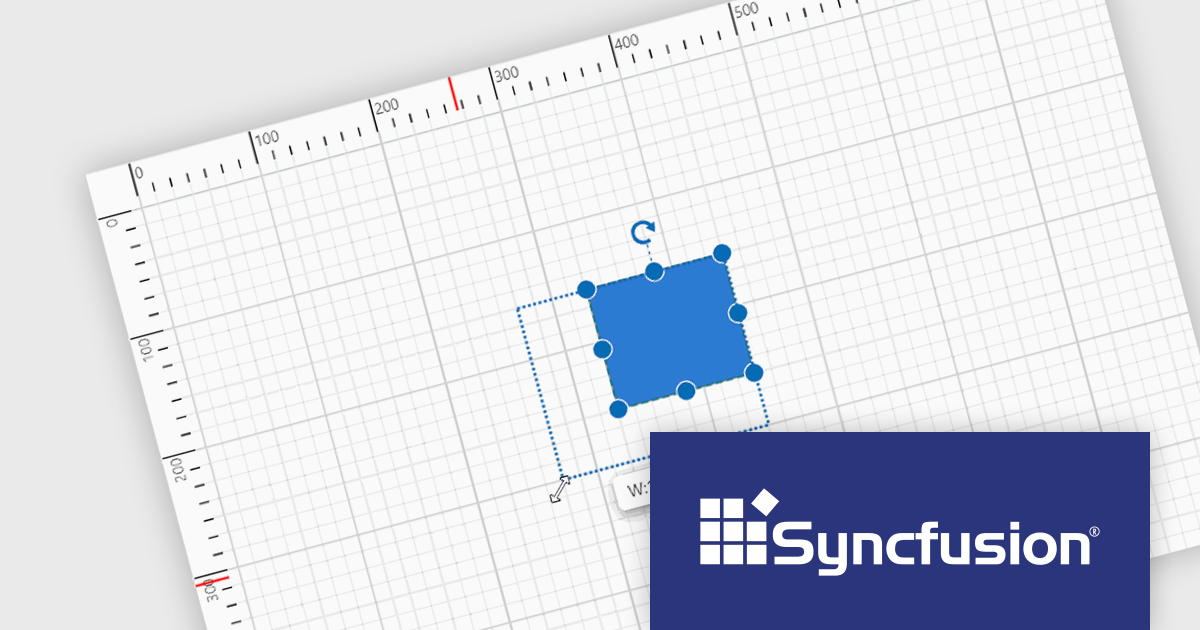
The Syncfusion Essential Studio Blazor 2024 Volume 2 (26.1.35) release introduces a ruler for the Diagram component, enhancing precision and simplifying element arrangement. This ruler provides both horizontal and vertical guides, allowing for visual measurement of object dimensions, indication of element positions, and alignment of various components. This significantly streamlines the creation of accurate and well-proportioned diagrams, particularly for tasks like crafting scale models.
To see a full list of what's new in 2024 Volume 2 (26.1.35), see our release notes.
Syncfusion Essential Studio Blazor is available as part of Syncfusion Essential Studio Enterprise which is licensed per developer starting with a Team License of up to five developers. It is available as a 12 Month Timed Subscription License which includes support and maintenance. See our Syncfusion Essential Studio Enterprise licensing page for full details.
Learn more on our Syncfusion Essential Studio Blazor product page.
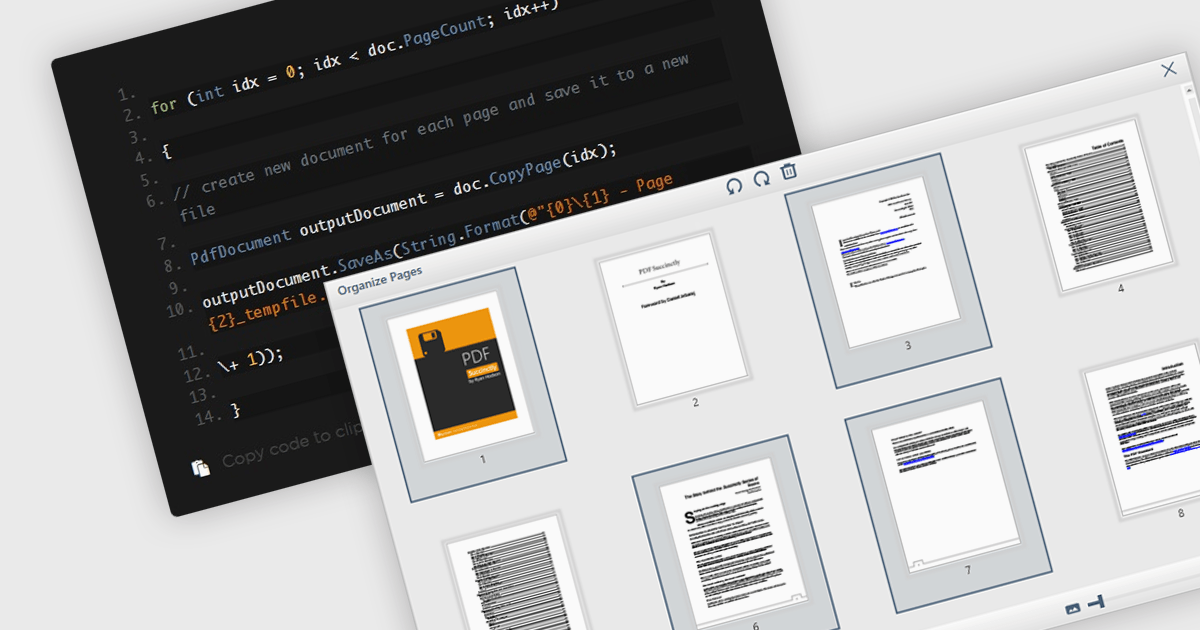
Extracting pages from PDFs offers significant advantages for streamlined workflows and information management. It allows users to focus on specific sections of a document for targeted reading or sharing, reduces file size when sending only relevant content, and simplifies the creation of new documents from existing PDFs, ultimately boosting productivity and enhancing document organization.
Several WPF PDF components offer the ability to extract pages from a PDF file including:
For an in-depth analysis of features and price, visit our WPF PDF Components comparison.
Syncfusion Essential Studio .NET MAUI, available as part of Syncfusion Essential Studio Enterprise, empowers developers with a comprehensive suite of native UI controls, data visualization tools, and performance optimizations for building modern, cross-platform mobile and desktop applications. This professional-grade toolkit leverages the power of C# and XAML, enabling rapid development of stunning and responsive experiences across diverse platforms.
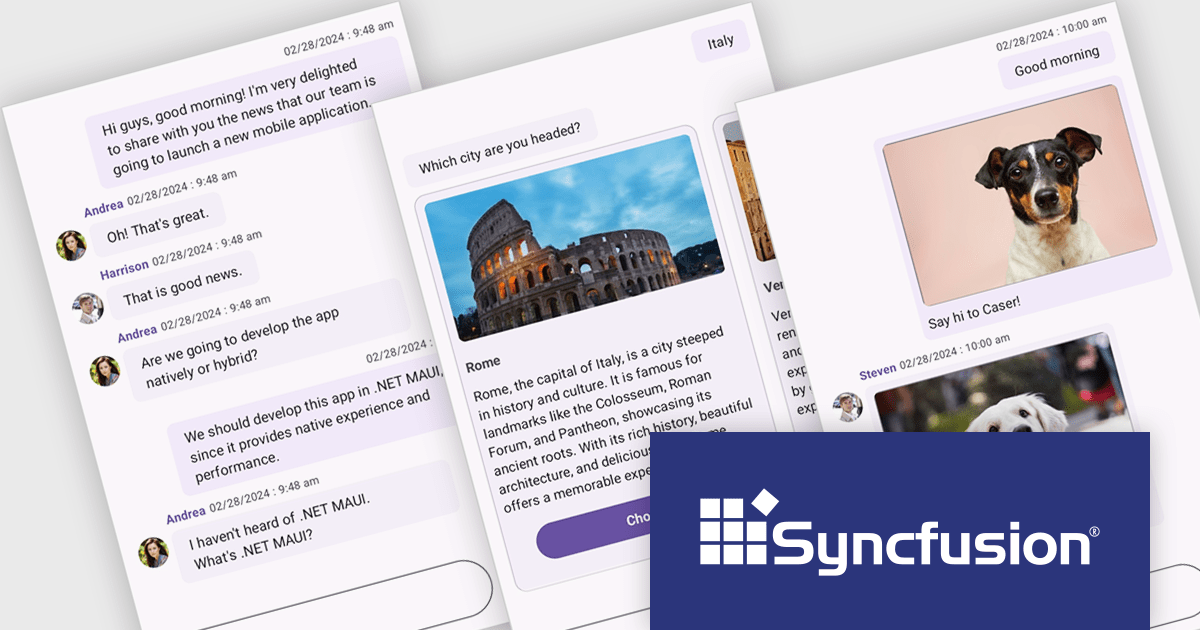
The Syncfusion Essential Studio .NET MAUI 2024 Volume 2 (26.1.35) release introduces the production-ready Chat component, enabling modern chat experiences within your .NET MAUI applications. This flexible component offers a fully customizable layout for displaying conversations between multiple users. It supports messages with content types, including text, images, hyperlinks, and cards, and even allows for integration with chatbot frameworks.
To see a full list of what's new in 2024 Volume 2 (26.1.35), see our release notes.
Syncfusion Essential Studio .NET MAUI is available as part of Syncfusion Essential Studio Enterprise which is licensed per developer starting with a Team License of up to five developers. It is available as a 12 Month Timed Subscription License which includes support and maintenance. See our Syncfusion Essential Studio Enterprise licensing page for full details.
Learn more on our Syncfusion Essential Studio .NET MAUI product page.
ComponentOne Studio ASP.NET MVC by MESCIUS offers a suite of UI controls designed to expedite development in ASP.NET MVC web applications. These fast, mobile-friendly controls encompass data management like grids, data visualization with charts, and layout components. This empowers you to create feature-rich dashboards and user interfaces. ComponentOne Studio ASP.NET MVC boasts professional design, deep customization options, and project templates to accelerate development, making it a valuable asset for crafting modern, responsive web applications.
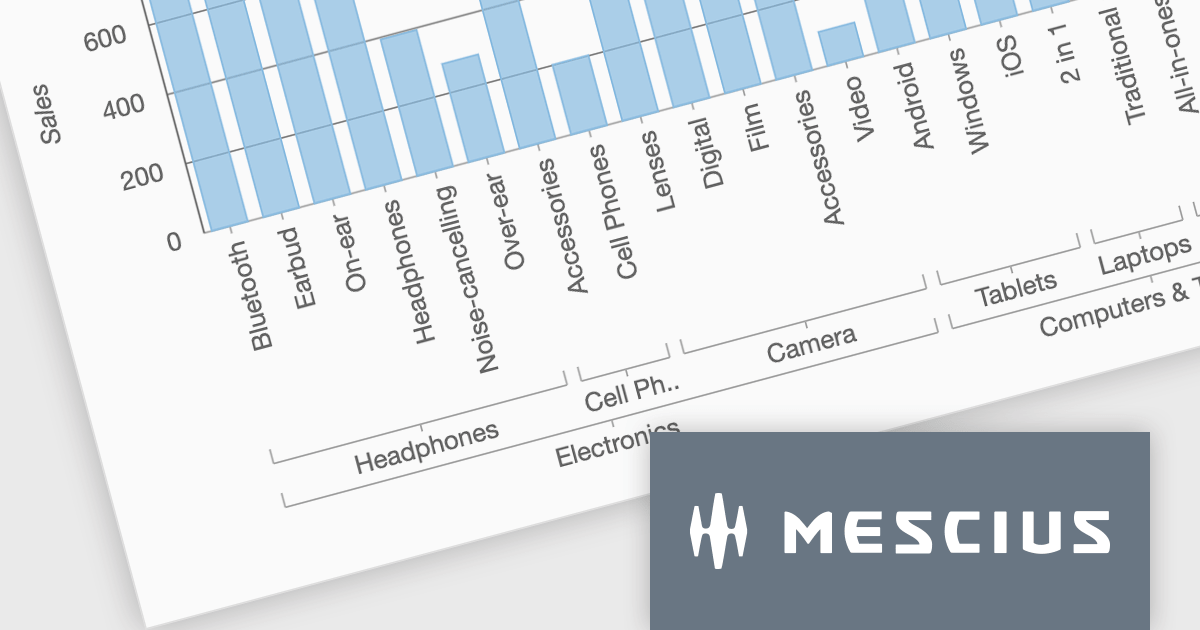
The ComponentOne Studio ASP.NET MVC 2024 v1 update introduces axis grouping for FlexChart, enhancing data analysis and visualization. This new feature leverages the grouping capabilities within your data source to automatically group axis labels where possible. This reduces chart clutter, improves readability, and empowers developers to present complex datasets with clear hierarchies, allowing for a more efficient user experience.
To see a full list of what's new in 2024 v1, see our release notes.
ComponentOne Studio ASP.NET MVC is licensed per developer on a perpetual basis and includes a 12 month subscription. See our ComponentOne Studio ASP.NET MVC licensing page for full details.
Learn more on our ComponentOne Studio ASP.NET MVC product page.
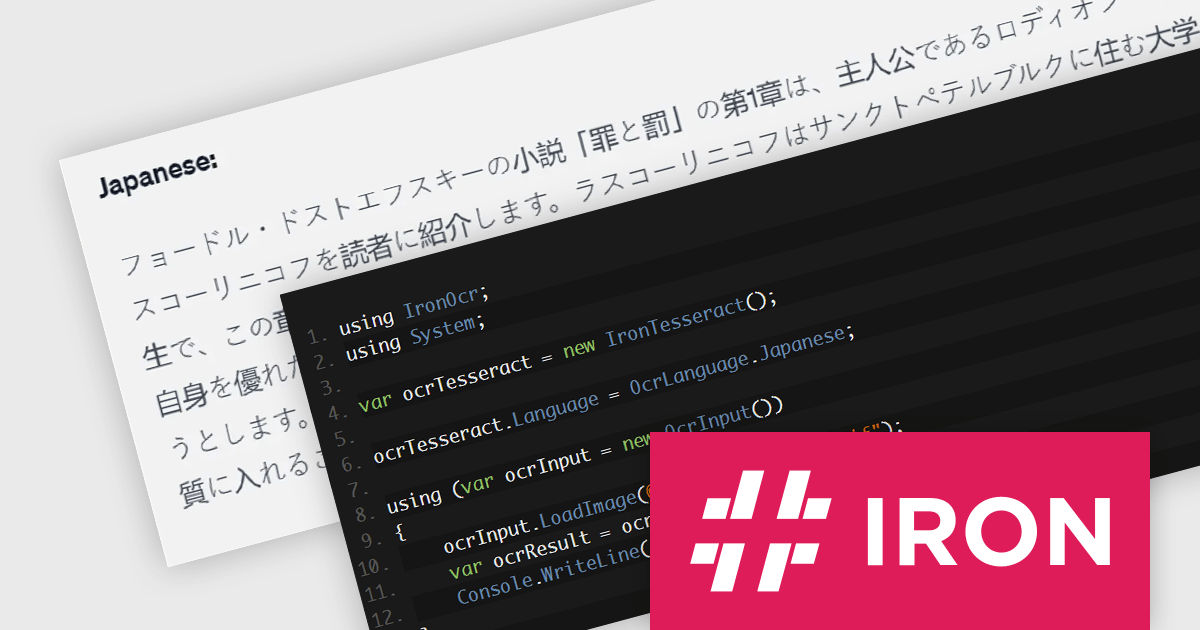
IronOCR for .NET by Iron Software is a C# library designed for adding advanced Optical Character Recognition (OCR) functionality to .NET applications. It leverages the Tesseract engine for accurate text, barcode, and QR code recognition from all major image and PDF formats. It is compatible with a variety of platforms (including C#, VB.NET, F#), operating systems (such as Windows, macOS, Linux), and IDEs (for example Visual Studio, JetBrains ReSharper and Rider). IronOCR offers a variety of features, supports over 127 languages, and provides a comprehensive solution for text extraction needs, enabling developers to implement OCR capabilities efficiently and effectively.
The IronOCR for .NET 2024.6.3 update enhances its advanced scan mode by supporting a wider range of languages including Chinese, Traditional Chinese, Japanese, Korean, and Latin. This enhancement significantly broadens an application's utility in global markets by allowing for text, barcode, and QR code recognition in more languages. Crucial for businesses operating internationally or in multilingual environments, this streamlines text extraction workflows and increases the versatility of their .NET projects whilst making it easier to handle complex script languages. By expanding the supported languages, developers can now cater to a more diverse user base, ensuring that their applications are accessible and relevant to a wider audience.
To see a full list of what's new in 2024.6.3, see our release notes.
IronOCR for .NET is licensed based on the number of developers, organization locations and projects, and is available as a Perpetual license with one free year of product updates and support services. See our IronOCR for .NET licensing page for full details.
IronOCR for .NET is available in the following products:
聯繫電話: (888) 850 9911
傳真: +1 770 250 6199


