


官方供應商
我們作為官方授權經銷商,直接提供超過200家開發廠家所發行超過1000個的產品授權給您。
請參閱我們所有的品牌。
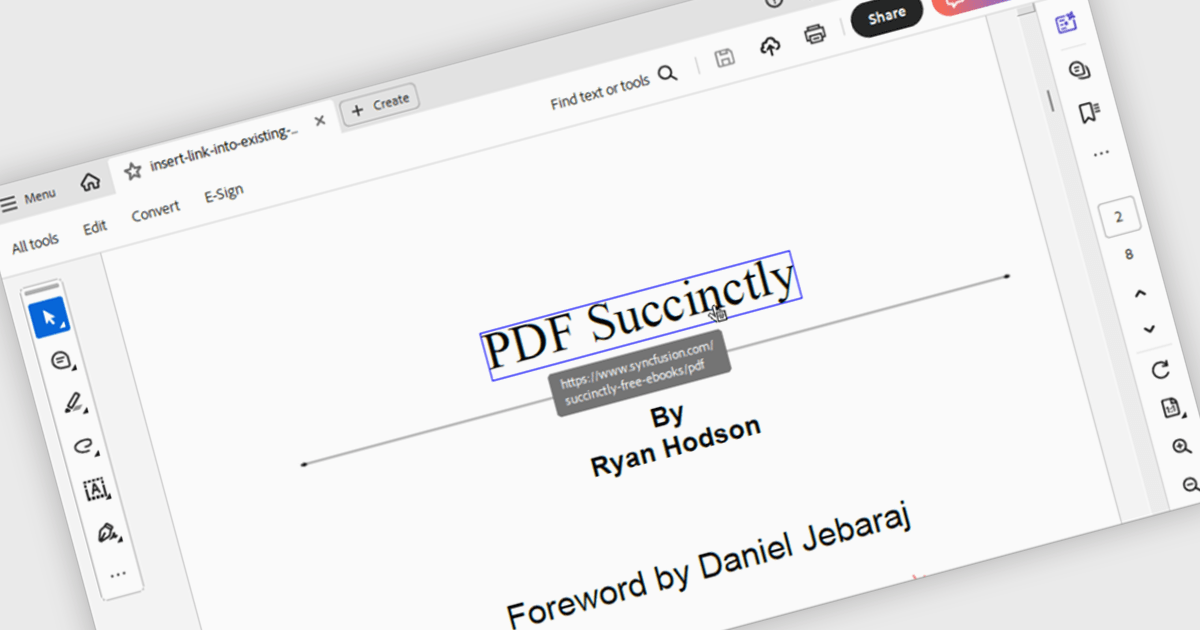
Hyperlink navigation in a PDF component refers to the ability to detect and interact with links embedded within a PDF document, allowing users to jump to external URLs, internal pages, or named destinations directly from the viewer. This functionality enhances the user experience by supporting transitions within or outside the document without manual scrolling or searching. For developers, it enables the creation of interactive documents and applications where navigation is intuitive, efficient, and consistent with modern document consumption expectations.
Several WinForms PDF components support hyperlink navigation, including:
For an in-depth analysis of features and price, visit our comparison of PDF components for WinForms.
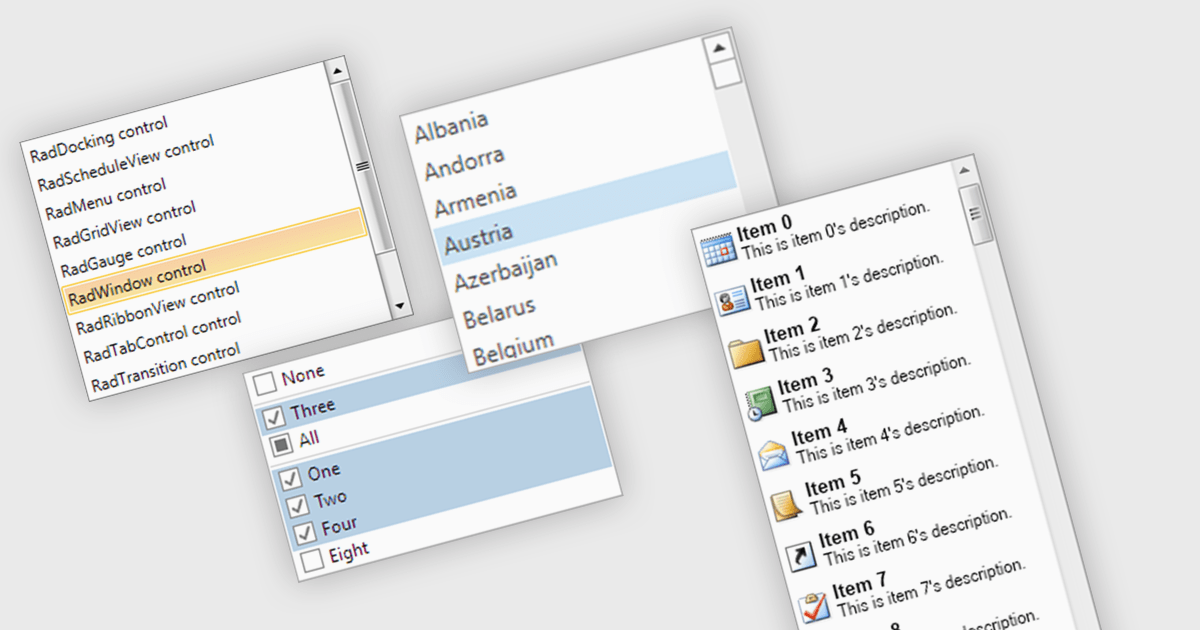
A listbox is a user interface component that displays a collection of items from which a user can select one or more options. It is commonly used in forms, settings panels, or data entry screens to present predefined values in a scrollable format. For developers, a listbox offers a simple way to enforce valid input by limiting user choices, reduces the need for manual data entry, and improves UI consistency across applications. It also supports keyboard and mouse interaction, which helps enhance accessibility and usability without requiring complex custom controls.
Several .NET WPF data editor collections provide listbox controls including:
For an in-depth analysis of features and price, visit our .NET WPF Data Editors comparison.
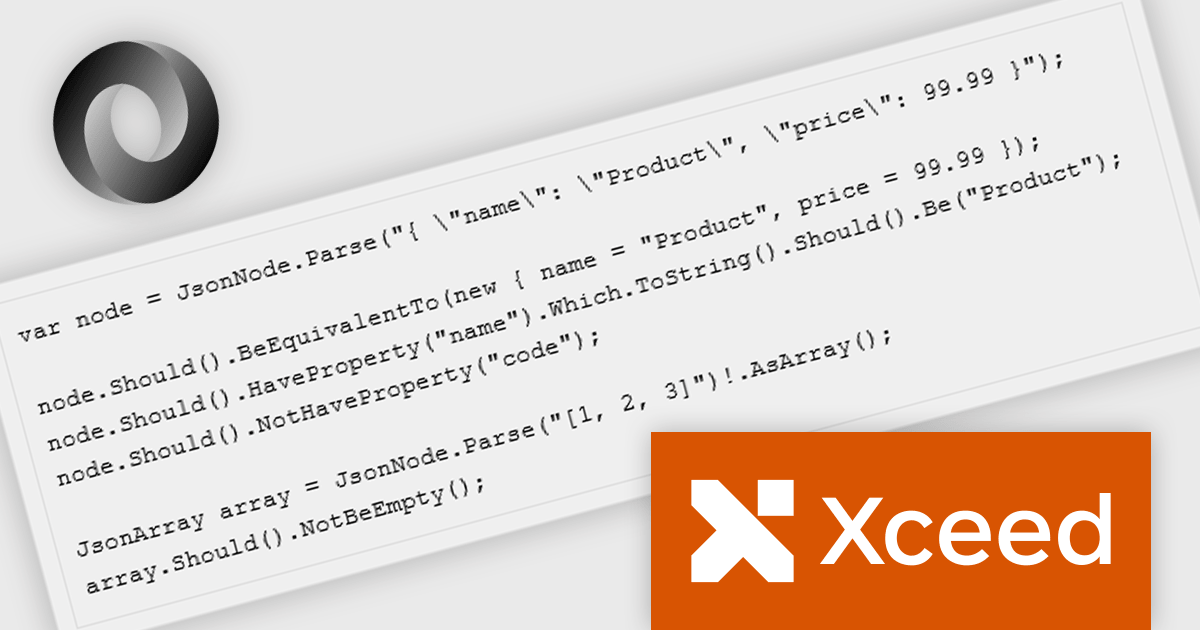
Xceed Fluent Assertions, developed by Xceed Software, is a new .NET library designed to enhance the readability and maintainability of unit tests. It provides a fluent interface for expressing assertions, allowing developers to write more natural and expressive test code. Instead of relying on traditional, often convoluted assertion syntax, Xceed Fluent Assertions enables developers to chain together methods that clearly articulate the expected outcomes of their tests. This promotes a more declarative style of testing, making it easier to understand the intent and logic behind each test case.
The Fluent Assertions 8.7 update introduces JSON-native assertions with first-class JSON support, enabling developers to validate JSON payloads directly within their tests. This enhancement allows precise verification of structure, data types, and values on JsonNode and JsonArray objects without the need for manual parsing or custom helper methods. By treating JSON as a native element in the assertion framework, the update improves API and integration testing, improves test clarity, and reduces maintenance overhead associated with complex JSON comparisons.
To see a full list of what's new in v8.7, see our release notes.
Xceed Fluent Assertions is licensed per developer and is available as a perpetual license with 1 year of updates and support. See our Xceed Fluent Assertions licensing page for full details.
Xceed Fluent Assertions is available individually or as part of Xceed Ultimate Suite.
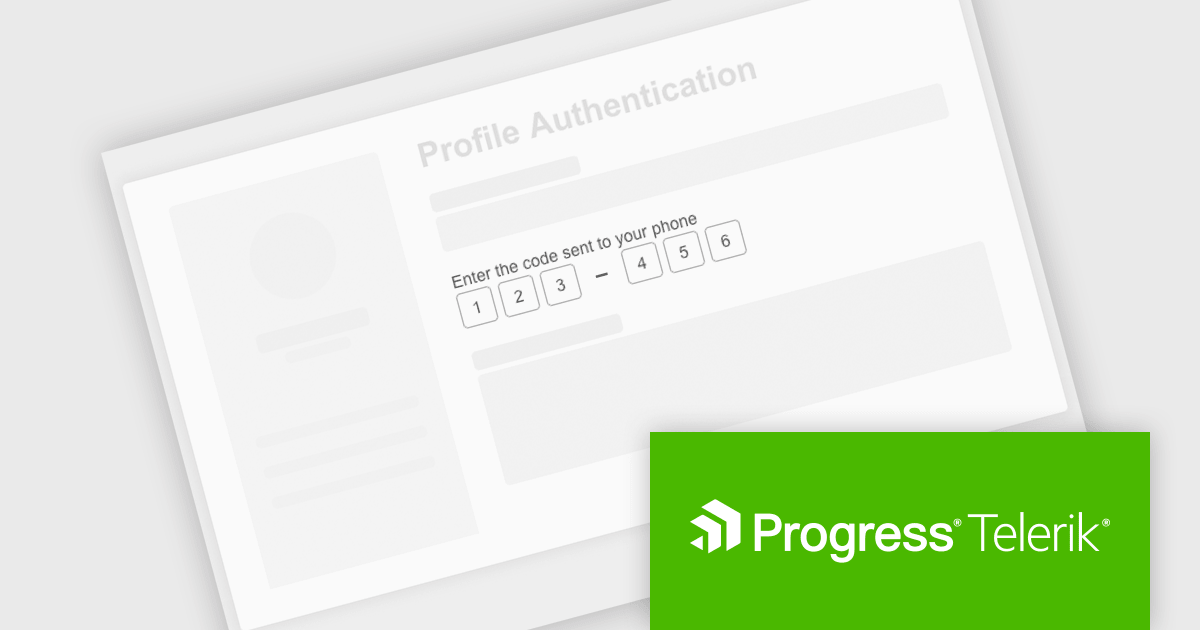
Telerik UI for ASP.NET AJAX is a library of over 120 user interface components designed for developers building Web Forms applications on the ASP.NET AJAX framework. It provides a variety of pre-built and high-performant controls which are fully customizable, ranging from data management to layout, navigation and data visualization. This feature-rich suite allows for the creation of responsive and visually appealing web applications, whilst enabling developers to enhance the user experience and expedite the development process.
The Telerik UI for ASP.NET AJAX 2025 Q3 update introduces a new One-Time Password (OTP) Input control that enhances application security by improving the integration of multi-factor authentication. This control provides a dedicated interface for handling one-time password entries, ensuring a consistent and reliable verification process across applications. It is fully customizable in terms of size, style, and format, allowing alignment with existing application designs while maintaining strong protection against unauthorized access. This addition simplifies implementation for developers and supports secure workflows such as logins, password resets, and sensitive transactions.
To see a full list of what's new in 2025 Q3 (2025.3.812), see our release notes.
Telerik UI for ASP.NET AJAX is licensed per developer and has two licensing models: an annual Subscription License and a Perpetual License. The Subscription license provides access to the latest product updates, technical support, and exclusive benefits for a flat annual fee, and must be renewed to continue using the software. The Perpetual license is a one-time purchase granting access to the current released version and includes a one-year subscription for product updates and technical support. After this initial period, users can choose to renew the subscription element to continue receiving updates and support; otherwise, they may continue using the installed version available during their active subscription term but will forgo future updates and support. See our Telerik UI for ASP.NET AJAX licensing page for full details.
Telerik UI for ASP.NET AJAX is available individually or as part of the following products:
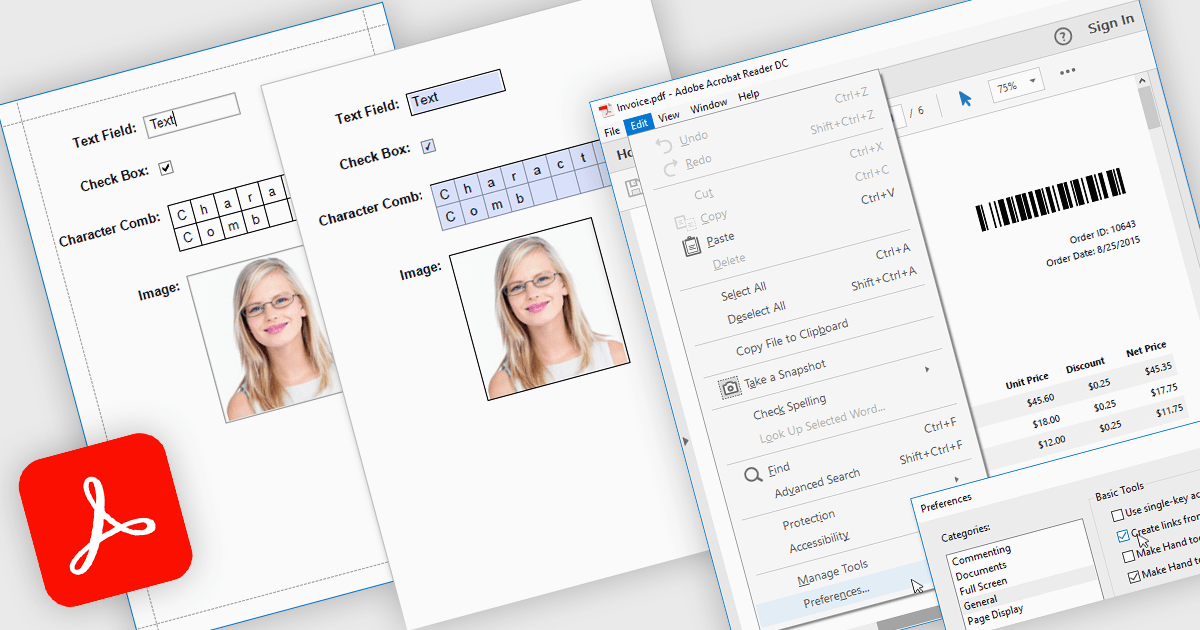
Exporting reports to PDF with AcroForms enables reports to be saved as PDF files containing fully interactive form fields, rather than static text. Editable elements such as text boxes, checkboxes, radio buttons, and drop-down lists remain fillable after export, allowing users to complete forms directly in standard PDF viewers like Adobe Acrobat Reader - without the need for specialized software. The benefits are considerable: organizations can reduce manual data entry, maintain consistent formatting across distributed documents, and improve accessibility for end users. For instance, a company might export an invoice report with editable billing details, create a survey that recipients can fill out digitally, or generate compliance forms that clients can complete and return electronically. By embedding interactive fields directly into exported reports, AcroForms help make document workflows more efficient, accurate, and user-friendly.
Several .NET WPF reporting controls offer Export to PDF with AcroForms including:
For an in-depth analysis of features and price, visit our comparison of .NET WPF reporting controls.
聯繫電話: (888) 850 9911
傳真: +1 770 250 6199


